
|
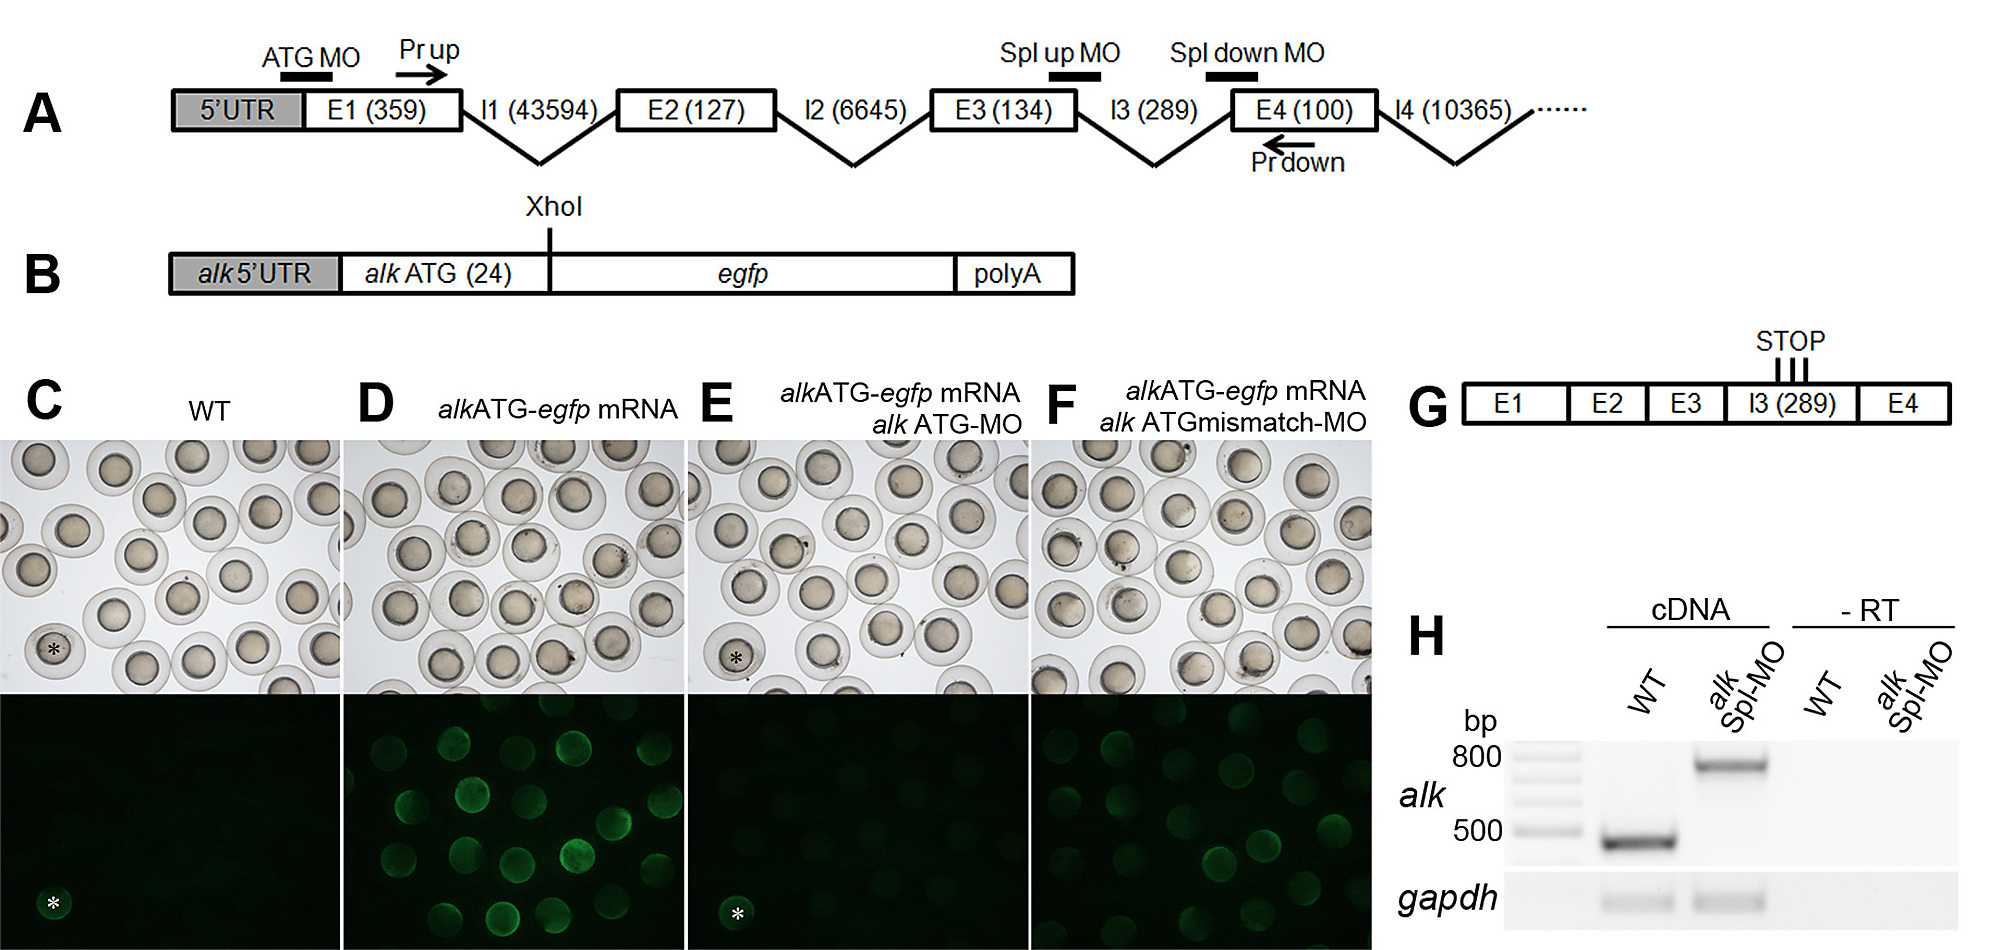
Fig. S5 alk MO efficiency test experiments. (A) A schematic diagram showing arrangement of the first four alk exon-intron boundaries and MO binding sites. Numbers show exon/intron sizes in basepairs. (B) A construct containing egfp inserted in frame with the alk ATG site was generated to test the binding efficiency of ATG-MO. (C–F) Injection of this mRNA in combination with MOs resulted in different EGFP translation levels. Embryos at 8 hpf, with bright field images on top and fluorescent images below. Injection of the mRNA resulted in EGFP signal (D). Co-injection with alk ATG-MO blocked its translation (E). alk ATGmismatch-MO did not block its translation (F). Embryos labeled with asterisks in (C) and (E) were taken from the group shown in (D), indicating sufficient fluorescent excitation. (G) A diagram showing aberrant splice products with retention of intron 3, when alk pre-mRNA splicing is blocked by splicing MOs. (H) RT-PCRs were used to test splicing MO efficiency by primers indicated in (A). In Spl-MO injected 24 hpf embryos, the PCR product size was increased by approximately 300 bp (2nd lane) when compared to uninjected wild-type (1st lane), indicating retention of intron 3. -RT controls (3rd and 4th lanes, without reverse transcriptase in cDNA synthesis) excluded contamination by genomic DNA. gapdh was used as loading control.