
|
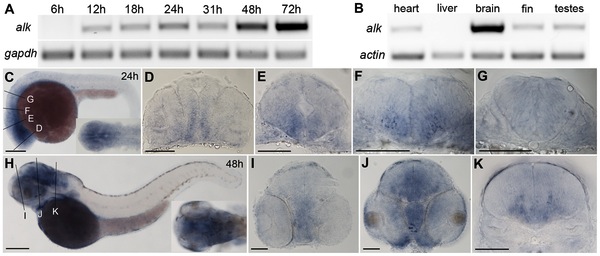
Fig. 1 Expression of zebrafish alk.
(A) RT-PCR of cDNA at different embryonic stages. gapdh is used as loading control. (B) RT-PCR of cDNA from different adult tissues. beta-actin is used as loading control. (C) Lateral view of whole embryos at 24 hpf with dorsal up and anterior to the left. Insert shows dorsal view of head region. (D–G) Transverse sections of embryos at 24 hpf, at forebrain (D), midbrain (E), rhombomere 2 (r2; F) and r5 (G) levels, corresponding to positions indicated by lines in (C). (H) Lateral view of whole embryo at 48 hpf with dorsal up and anterior to the left. Insert shows dorsal view of head region. (I–K) Transverse sections of embryos at 48 hpf at forebrain (I), midbrain (J), and r5 (K), corresponding to positions indicated by lines in (D). Scale bars: C,H, 200 μm; D–E,I–K, 100 μm.