
- Title
-
Spatiotemporal manipulation of retinoic acid activity in zebrafish hindbrain development via photo-isomerization
- Authors
- Xu, L., Feng, Z., Sinha, D., Ducos, B., Ebenstein, Y., Tadmor, A.D., Gauron, C., Le Saux, T., Lin, S., Weiss, S., Vriz, S., Jullien, L., and Bensimon, D.
- Source
- Full text @ Development
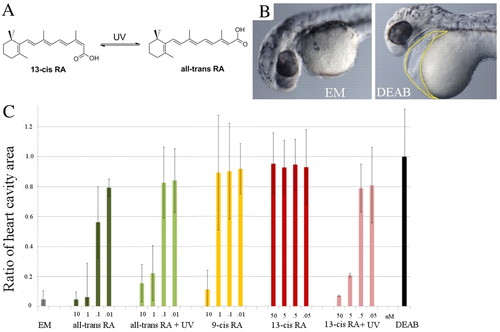
Developmental response to various concentrations of different RA isomers. (A) Isomerization reaction of 13-cis RA into all-trans RA (and vice versa). (B) Typical phenotype of a zebrafish embryo incubated in embryo medium (EM) and in DEAB. Note the enlarged heart cavity (area enclosed by yellow line). (C) Developmental response of embryos incubated in DEAB to transient (5-minute) incubation in various concentrations of all-trans RA, 9-cis RA and 13-cis RA, subjected or not to UV illumination and fixed in 4% paraformaldehyde at 33 hpf. Since the heart cavity is enlarged in DEAB, we used the ratio of its transverse area (as enclosed by the yellow line in B) to the value in DEAB as a means to quantify the rescue (which is maximal when the ratio is minimal). Note that rescue of heart development requires <1 nM all-trans RA, 10 nM 9-cis RA or 5 nM 13-cis RA plus UV illumination (1 minute). No rescue is observed in up to 50 nM 13-cis RA. The number of embryos used for each condition is <20. Error bars indicate s.d. |
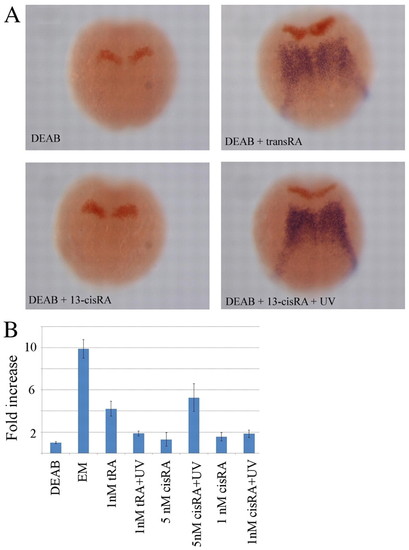
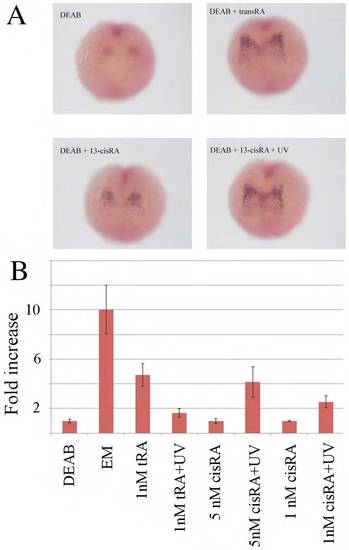
Response of vhnf1 to transient exposure to all-trans RA and 13-cis RA. Zebrafish embryos were incubated from sphere stage in 10 μM DEAB (except for the control incubated in embryo medium, EM), exposed at 90% epiboly for 5 minutes to various concentrations of all-trans RA (tRA) and 13-cis RA (cisRA) and UV illuminated (for 1 minute) or not. (A) In situ hybridization at the 1- to 2-somite stage for vhnf1 (blue) and krox20 (red) in embryos incubated in DEAB and 5 nM 13-cis RA (no vhnf1 is visible) or DEAB plus 1 nM all-trans RA and DEAB plus 5 nM 13-cis RA plus 1-minute UV illumination (rescue of vhnf1 expression is visible). (B) Quantification of the expression of vhnf1 by RT-qPCR in various conditions. Note that the expression of vhnf1 in 1 nM all-trans RA is similar to that in 5 nM 13-cis RA plus UV. Also, the expression of vhnf1 is similar in 1 nM all-trans RA plus UV and 1 nM 13-cis RA plus UV, as expected because in both cases the concentration of all-trans RA after UV illumination is the same. Error bars indicate s.e.m. from five experiments (for each experiment, RT-qPCR for the various genes was performed in triplicate). |
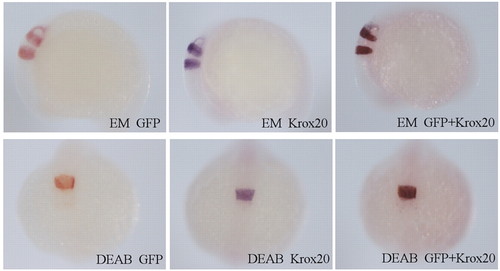
Response of the GFP transgenic embryos to DEAB and RA treatments. gfp expression in r3 and r5 in transgenic zebrafish embryos incubated in EM or 10 μM DEAB (from sphere stage). (Top row) In situ hybridization of embryos grown in EM at the 12- to 14-somite stage for gfp (red), krox20 (a known marker of r3 and r5, blue) and both gfp and krox20. Side view. (Bottom row) In situ hybridization of embryos grown in DEAB for gfp, krox20 and both gfp and krox20. Dorsal view. gfp expression reproduces the response of krox20. Since gfp allows the monitoring of live embryos, we have used it to quantify their response to all-trans RA. |
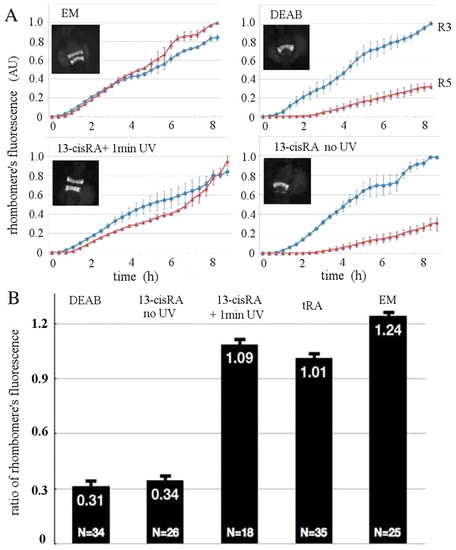
Quantification of RA response in the GFP transgenic line. (A) Dynamics of the total expression of GFP in r3 and r5 in transgenic zebrafish embryos incubated from sphere stage in 10 μM DEAB (except for the control incubated in embryo medium, EM). Some of the embryos were exposed at 90% epiboly for 5 minutes to 13-cis RA (cisRA) and illuminated (or not) for 1 minute with a UV lamp. GFP fluorescence can be detected at <6 somites, which defines the time origin in these data. From the almost linear increase with time of the fluorescence in r3 and r5, we deduce that the ratio of fluorescence of r5 to r3 is a good proxy for the response to all-trans RA. Error bars indicate s.d. from the dynamics measured in three different embryos for each condition. Insets show typical fluorescent images of the embryos at 24 hpf. (B) To quantify the response of the embryos to all-trans RA exposure we measured the ratio of total fluorescence in r5 versus r3 in 24-hpf embryos. It is minimal in DEAB and in the presence of 5 nM 13-cis RA, but is almost normal (maximal) in embryos transiently incubated in 1 nM all-trans RA (tRA) or 5 nM 13-cis RA plus 1-minute UV illumination. Error bars indicate s.e.m. |
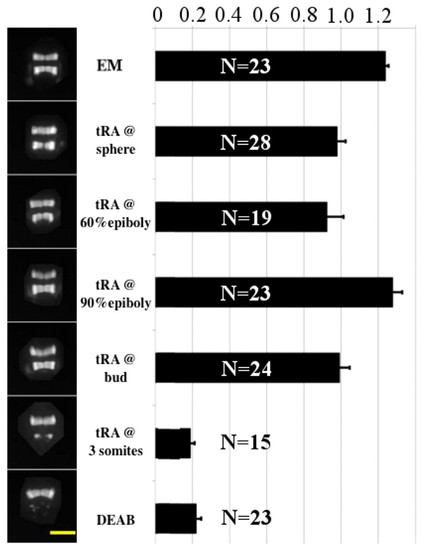
Rescue of hindbrain upon an all-trans RA pulse at various developmental stages. Rescue of hindbrain development in zebrafish embryos expressing GFP in r3 and r5, continuously incubated in 10 μM DEAB from sphere stage (4 hpf) and exposed for 5 minutes to 1 nM all-trans RA (tRA) at various developmental stages (except for the control incubated in embryo medium, EM). On the left are shown typical patterns of GFP expression at 24 hpf. On the right is shown the average ratio of total fluorescence in r5 versus r3. Note that exposure to all-trans RA until bud stage yields an almost normal pattern of hindbrain development, whereas exposure to all-trans RA at the 3-somite stage (11 hpf) does not rescue normal development of r5. Error bars indicate s.e.m. Scale bar: 200 μm. |
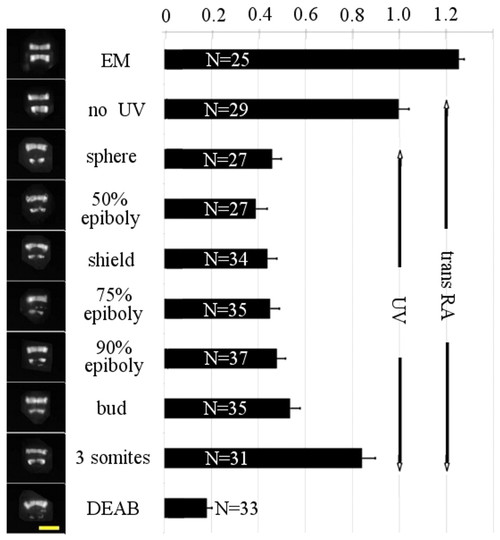
Partial abortive rescue of hindbrain upon UV illumination of all-trans RA. Hindbrain development in zebrafish embryos expressing GFP in r3 and r5, continuously incubated in 10 μM DEAB from sphere stage (4 hpf) and exposed for 5 minutes to 1 nM all-trans RA (tRA) at sphere followed at various developmental stages by UV illumination for 1 minute (which isomerizes, i.e. deactivates, <80% of all-trans RA). On the left are shown typical patterns of GFP expression at 24 hpf. On the right is shown the average ratio of total fluorescence in r5 versus r3. Note that UV illumination of the embryos until bud stage prevents full rescue of r5. Fuller rescue of hindbrain development by all-trans RA is however possible if UV illumination is performed at the 3-somite stage. Error bars indicate s.e.m. Scale bar: 200 μm. |
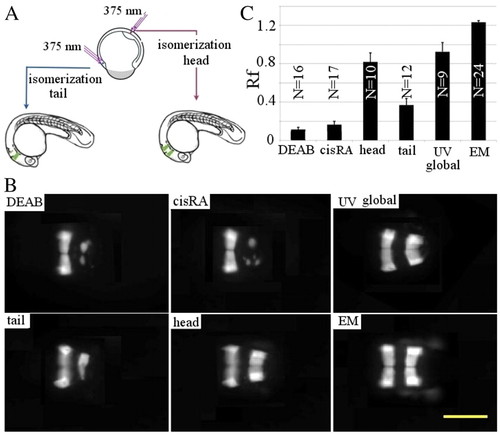
Local activation of RA via isomerization. Local activation of all-trans RA in zebrafish embryos at 80-90% epiboly (incubated from 4 hpf in 10 μM DEAB) by UV laser illumination at 375 nm following a 5-minute 13-cis RA (cisRA) pulse (5 nM) at 75% epiboly. (A) Schematics describing how embryos were illuminated in localized areas during embryogenesis (see Materials and methods for details). (B) Representative images of embryos incubated in EM (control), in EM plus DEAB, subjected to a 13-cis RA pulse and global UV illumination or to local UV laser-induced isomerization in the tail or head regions. (C) Quantification of the average ratio (Rf) of total fluorescence in r5 versus r3 for the different conditions in B. Error bars indicate s.e.m. Scale bar: 200 μm. |
Response of hoxb1a to transient exposure to all-trans RA. Quantification of the response of hoxb1a to various transient exposures to alltrans RA (tRA) and 13-cis RA (cisRA). The embryos were incubated from sphere stage in 10 mM DEAB (except for the control incubated in embryo medium, EM), exposed at 90% epiboly for 5 minutes to various concentrations of all-trans RA and 13-cis RA and UV illuminated (for 1 minute) or not. (A) In situ hybridization at the 1- to 2-somite stage against hoxb1a1 (blue) for embryos incubated in DEAB with or without 5 nM 13-cis RA, DEAB + 1 nM all-trans RA and DEAB + 5 nM 13-cis RA + 1 minute UV illumination (rescue of hoxb1a expression is visible). (B) Quantification of the expression of hoxb1a by RT-qPCR in various conditions. Note that the expression of hoxb1a in 1 nM all-trans RA is similar to the expression in 5 nM 13-cis RA + UV. Note further that the expression of hoxb1a is similar in 1 nM all-trans RA and 13-cis RA after UV illumination, as expected since in each case the concentration of all-trans RA after illumination is the same. Error bars are statistical errors on the mean from five experiments (each RT-qPCR assay was performed in triplicate). |
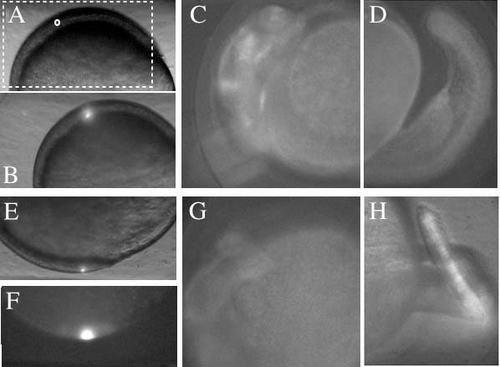
Local labeling with photo-activation of Kaede. Local illumination with a UV laser at ~80% epiboly in the precursor of the head region. To confirm the localization of the UV laser illumination we used the photoconversion of Kaede (from green to red fluorescence) to track the fate of the illuminated region. The mRNA encoding Kaede (Kohei et al., 2006) was injected at the one-cell stage. (A) Embryo overview. The boxed region indicating the anterior part of the embryo corresponds to the area shown in B,C. The region indicated by the small circle was selected for UV irradiation. (B) Twenty seconds of UV irradiation (bright spot) in the circled region in A. (C,D) At 24 hpf, red fluorescence from diffused Kaede was observed in the head (C), but not in the tail (D). (E) UV irradiation for 20 seconds in a region (bright spot) that develops into the tail. (F) Corresponding red fluorescent image immediately after photoconversion. (G,H) At 24 hpf, red fluorescence was observed in the tail (H) but not in the head (G). |