
Fig. 4
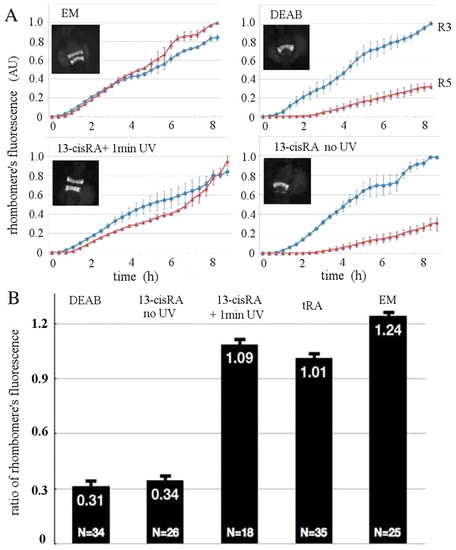
Quantification of RA response in the GFP transgenic line. (A) Dynamics of the total expression of GFP in r3 and r5 in transgenic zebrafish embryos incubated from sphere stage in 10 μM DEAB (except for the control incubated in embryo medium, EM). Some of the embryos were exposed at 90% epiboly for 5 minutes to 13-cis RA (cisRA) and illuminated (or not) for 1 minute with a UV lamp. GFP fluorescence can be detected at <6 somites, which defines the time origin in these data. From the almost linear increase with time of the fluorescence in r3 and r5, we deduce that the ratio of fluorescence of r5 to r3 is a good proxy for the response to all-trans RA. Error bars indicate s.d. from the dynamics measured in three different embryos for each condition. Insets show typical fluorescent images of the embryos at 24 hpf. (B) To quantify the response of the embryos to all-trans RA exposure we measured the ratio of total fluorescence in r5 versus r3 in 24-hpf embryos. It is minimal in DEAB and in the presence of 5 nM 13-cis RA, but is almost normal (maximal) in embryos transiently incubated in 1 nM all-trans RA (tRA) or 5 nM 13-cis RA plus 1-minute UV illumination. Error bars indicate s.e.m. |