
- Title
-
fras1 shapes endodermal pouch 1 and stabilizes zebrafish pharyngeal skeletal development
- Authors
- Talbot, J.C., Walker, M.B., Carney, T.J., Huycke, T.R., Yan, Y.L., Bremiller, R.A., Gai, L., Delaurier, A., Postlethwait, J.H., Hammerschmidt, M., and Kimmel, C.B.
- Source
- Full text @ Development
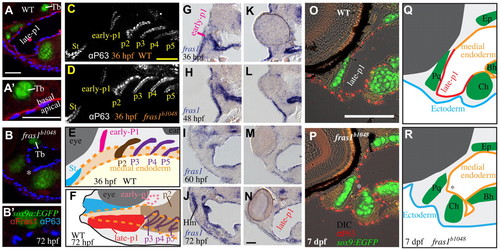
Zebrafish fras1 mutants show specific late-p1 defects. (A-B′) Transverse sections of antibody-stained tissues, oriented lateral to left, dorsal up. (B) At the section level of late-p1, fras1 mutant endoderm does not extend as far laterally (asterisk) as WT endoderm at 72 hpf. (A′,B′) High-resolution detail near trabecula (Tb) from A and B shows that (A′) WT Fras1 is deposited basal to the epithelial nuclei marker and (B2) anti-Fras1 label is absent from fras1 mutants. Because these insets are from the roof of the mouth, basal is up and lateral is to the left. (C-E) By contrast, early pouches appear normal in fras1 mutants. (C,D) Confocal section of (C) WT and (D) fras1 mutant epithelia at 36 hpf, oriented anterior to left, dorsal up. Note that the early forming portion of pouch 1 is only mildly misshapen in fras1 mutants and posterior pouches appear normal. (E) Diagram of WT pouch structure at 36 hpf, viewed with anterior to left, dorsal up. Medial endoderm (orange dashed lines) lies beneath the plane of section shown in G and H (see supplementary material Fig. S2). Yolk is in yellow and somatic tissue is gray. (F) Diagram of pouch derivatives at 72 hpf, viewed with anterior to left, dorsal up. Between 36 and 72 hpf, late-p1 has protruded laterally, early-p1 has been covered by cartilages, and pouch 2 (p2) has extended posteriorly, covering posterior pouches. (G-N) RNA in situ hybridization on tissue sections, shown lateral to left, dorsal up. Epithelial fras1 expression lines pharyngeal arches during late-p1 formation. (G-J) Sections through early-p1 show that this early forming pouch is eventually covered by the hyomandibular cartilage, whereas (K-N) late-p1 protrudes laterally, anterior to early-p1. (O,P) Transverse sections of antibody-stained tissues, oriented lateral to left, dorsal up. Endodermal pouching defect persists in fras1 mutants at 7 dpf (asterisk). (Q,R) Illustrations of 7-dpf tissue sections, indicating the location of late-p1. Endoderm abbreviations: early-p1, early forming portion of pouch 1; late-p1, late-forming portion of pouch 1; p3, pouch 3; p4, pouch 4; p5, pouch 5; St, stomadeum. Cartilage abbreviations: Pq, palatoquadrate; Ch, ceratohyal; Bh, basihyal; Ep, ethmoid plate; Hm, hyomandibular. Scale bars: 50 μm (in A,A2,C,O for B,B2,D,P, respectively; in N for G-N). |
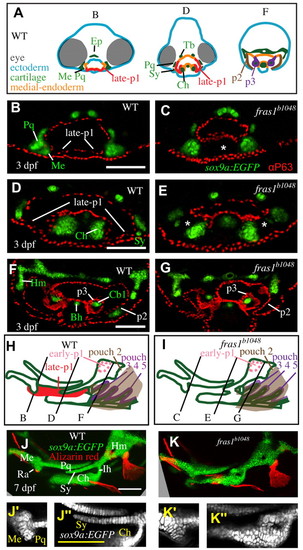
Skeletal elements near late-p1 are affected by fras1 mutation. (A) Illustrations of WT epithelia and cartilage on transverse sections, shown dorsal up. Ep, ethmoid plate; Tb, trabecula. (B-G) Tissue sections labeled with anti-P63 and sox9a:EGFP, taken from the section level of (B,C) Meckel′s-palatoquadrate joint, (D,E) symplectic cartilage, and (F,G) opercular flap. By 72 hpf, fras1 mutants exhibit loss (asterisk) of late-p1 (B-E) but not p2 or p3 (F,G) derivatives. (H,I) Illustrations of 7-dpf cartilaginous skeletons, showing how pouch derivatives intersect with cartilages and how the sections shown in B-G map onto 7-dpf skeletons; shown anterior to left, dorsal up. (J-K′′) Confocal projections of live-imaged fish showing bone (Alizarin Red staining) and cartilage (sox9a:EGFP expression). Dermal bone morphology typically resembles WT (J) in fras1 mutants (K), although mild opercle bone defects are sometimes found in fras1 mutants (not shown). Inset confocal sections highlight morphology at first arch-derived (J′,K′ ) and second arch-derived (J′′,K′′) joint regions. Fully expressive fras1 mutants display distinct cartilage defects including (K′) M-Pq fusion and (K′′) Sy-Ch fusion with short Sy. Arch 1-derived cartilages: Me, Meckel′s cartilage; Ra, retroarticular process of Meckel′s cartilage; Pq, palatoquadrate. Arch 2-derived cartilages: Cb1, first ceratobranchial cartilage; Ch, ceratohyal; Ih, interhyal; Hm, hyomandibular; Sy, symplectic. Scale bars: 100 μm (applicable to each row). EXPRESSION / LABELING:
PHENOTYPE:
|
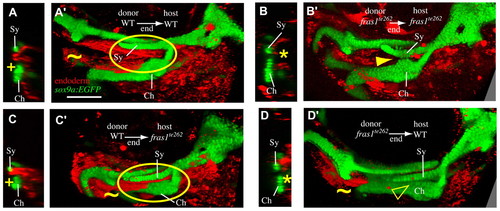
Endodermal fras1 sculpts epithelia and skeleton. Confocal transverse sections taken at a section level midway through Sy length at 7 dpf. Medial to right, dorsal up. (A) In mosaic fish in which WT endoderm has been transplanted into WT hosts (WT→WT mosaics), late-p1 appears normal (+) and is labeled as endoderm. (B) In fras1te262→fras1te262 mosaic fish, late-p1 does not form, and anterior endoderm remains medial to cartilages (asterisk). (C) WT endoderm transplanted into fras1te262 mutants rescues the late-p1 defects of these hosts. (D) Half of the fras1te262→WT mosaics examined exhibited defective endoderm medial to Sy and Ch. (A′-D′) Rendered confocal stacks show endoderm and skeletal morphology; oriented anterior to the left, dorsal up. Image rendering makes both tissues opaque, allowing visualization of late-p1 covering separated Sy and Ch cartilages (circled). In WT→WT (A′) and WT→fras1te262 (C′) mosaics, late-p1 covers part of Ch. However, in fras1te262→fras1te262 mosaics, fused cartilages cover the medial endoderm (arrowhead). Half of the fras1te262→WT mosaics show late-p1 defects, but cartilage defects are more subtle than in non-mosaic fras1te262 mutants, perhaps owing to the presence of late-p1 in the first pharyngeal arch (tilde). Scale bar: 100 μm. |
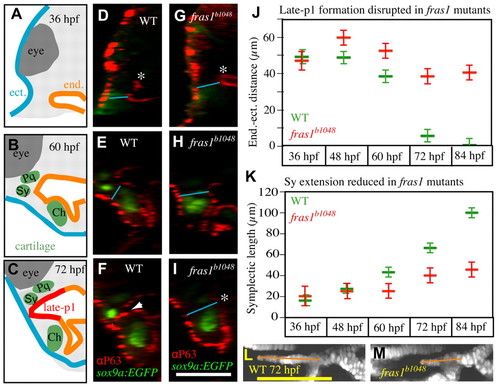
fras1-dependent symplectic extension occurs concurrently with late-p1 formation. (A-C) Schematics of the transverse sections shown in D-I, illustrating ectoderm (blue), endoderm (orange), cartilage (green), somatic tissue (gray) and eye (dark gray). (D-I) Transverse view of confocal stacks, showing WT late-p1 formation between 36 and 72 hpf (D-F, arrowhead), which fails (asterisk) in fras1 mutants (G-I). (J,K) Measurements of (J) endoderm-ectoderm distances and (K) Sy lengths, taken from the same fish. (J) Minimum distance between endoderm and ectoderm measured as illustrated (blue lines in D-I) on randomly selected fish. Endoderm-ectoderm distance decreases in WT fish but remains relatively constant in fras1 mutants. (K) Symplectic length, as measured from above the center of interhyal to the anterior tip of the symplectic (orange lines in L,M). At 36 hpf, symplectic cartilage precursors do not protrude beyond the bulk of the second arch sox9a:EGFP expression, so 36-hpf ‘Sy length’ is measured from the anterior edge of second arch sox9a:EGFP expression to its center. (L,M) Confocal section of 72-hpf symplectic cartilage, illustrating Sy length measurements (orange lines); oriented anterior to left, dorsal up. Error bars show mean ± 1.96 times the s.e. Scale bars: 100 μm (in I for A-I; in L for L,M). EXPRESSION / LABELING:
PHENOTYPE:
|
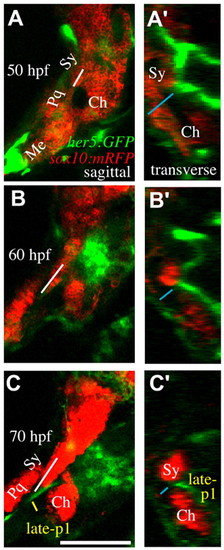
Time-lapse microscopy reveals concurrent late-p1 and symplectic outgrowth. (A-C′) sox10:mRFP labels cartilages and her5:GFP labels late-p1 and some neural cells in these sections. Still images from time-lapse microscopy showing symplectic growth (white line in A-C) and endoderm-ectoderm distance (blue line in A′-C′). (A-C) Sagittal confocal section, anterior to left, dorsal up. By 70 hpf, symplectic tip extends out of the plane of section. (A′-C′) Transverse view, lateral to left, dorsal up, constructed from the same confocal stacks. Between 50 and 70 hpf, late-p1 moves laterally through a region between the symplectic and ceratohyal cartilages. By 70 hpf, development is slightly delayed, resulting in a mild reduction of late-p1 and cartilage formation. Scale bar: 100 μm. |
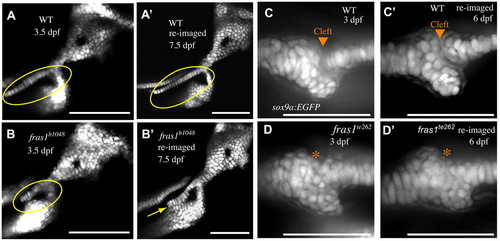
Me-Pq fusion occurs by 72 hpf, whereas Sy-Ch fusion often occurs later. (A-B′) Confocal sections of second arch-derived zebrafish skeleton at 3.5 dpf (A,B) and the same skeletal elements reimaged later in development (A′,B′). Anterior to left, dorsal up. By 3.5 dpf, a large gap is present between WT symplectic and ceratohyal cartilages (A), and this gap persists through larval development (A′). In fras1 mutants, although there is often a space between symplectic and ceratohyal cartilage (B, circled) at 3.5 dpf, these skeletal elements are typically found fused together when examined later in larval development (B′, yellow arrow). (C-D′) Confocal projections of first arch joint region, shown anterior to left and dorsal up. By 3 dpf, WT embryos have formed a cleft between Meckel′s and palatoquadrate cartilages (C), which persists as the embryos develop (C′). When fras1 mutants show skeletal fusions in the first arch (D, asterisk) they are always visible by 3 dpf, and persist when re-examined later in larval development (D′). Scale bars: 100 μm. EXPRESSION / LABELING:
PHENOTYPE:
|
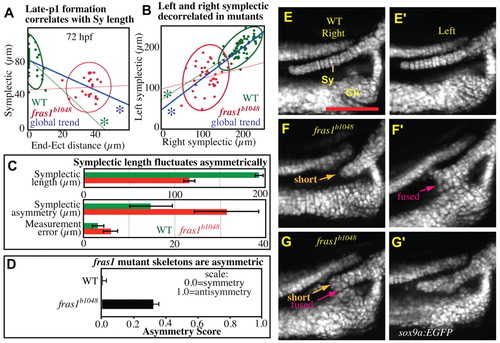
Skeletal phenotypes fluctuate asymmetrically in fras1 mutants. (A) Plot of 72-hpf right symplectic length versus right endoderm to ectoderm distance, measured as in Fig. 4, with grouped 95% density ellipses. Linear regression reveals that significant correlation (asterisk) between endoderm-ectoderm distances and symplectic length exists in the grouped data, and in WT fish, but not fras1 mutants. All fras1 mutant fish show endoderm-ectoderm distance defects; however, fras1 mutant symplectic lengths are sometimes within the WT range. (B,C) Symplectic length analysis on fish live-imaged at 7.5 dpf. For each side, symplectic length was measured twice, then averaged. (B) Plot of left versus right symplectic length, with grouped 95% density ellipses. In fras1 mutants, linear regression does not reveal a significant correlation between left and right symplectic lengths. (C) fras1 mutants show fluctuating asymmetry, twofold higher than WT. This increase in fluctuating asymmetry is much larger than can be accounted by measurement error. Asymmetry is the absolute value of length differences between sides. Measurement error is estimated as the difference between paired measurements on one side of a fish. (D) Overall skeletal asymmetry of 7.5-dpf fish, calculated as A=(|Sy shortl-r| + |Sy-Ch fusionl-r| + |Me-Pq fusionl-r|) / 3N. (E-G′) Second arch joint region of right (E-G) and left (E′-G′) individuals imaged live at 7.5 dpf; anterior to left, dorsal up. Compared with WT fish (E,E′), fras1 mutant phenotypes are often asymmetric (F-G′). For instance, a fish presenting a short, but unfused, symplectic cartilage on one side (F) also shows an extended, but fused, symplectic cartilage on the opposite side (F′). Conversely, the ‘short’ and ‘fused’ symplectic phenotypes (G) can be found on one side of a fish that presents only subtle defects (G′) on the opposite side. Error bars show mean ± 1.96 times the s.e. Scale bar: 100 μm. EXPRESSION / LABELING:
PHENOTYPE:
|
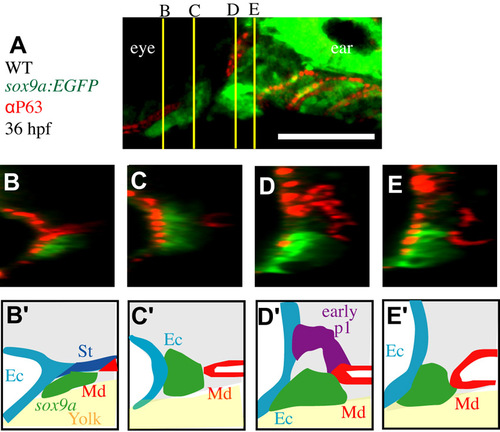
Early pouching appears normal in fras1 mutants. (A) Confocal section of WT pharyngeal arches, with pre-cartilage cells labeled using sox9a:EGFP and epithelial nuclei labeled using anti-P63; shown anterior to left, dorsal up. Yellow lines indicate section levels for B-E. (B-E) Four confocal transverse sections through arches one and two, reconstructed from a confocal stack of the embryo imaged for A, shown lateral to the left, dorsal up. (B′-E′) Epithelial morphology. At 36 hpf a tube of endoderm lies medial to the length of arches; early-p1 separates arch one and two mesenchyme dorsally, and posterior pouches fully separate posterior arch mesenchyme. Ec, surface ectoderm; Md, medial endoderm; p2, pouch 2; p3, pouch 3; p4, pouch 4; St, stomadeum. Scale bar: 100 μm. |