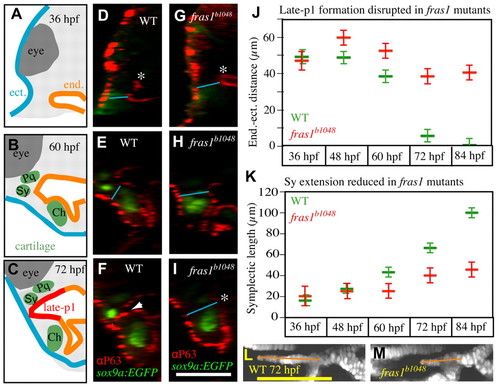
fras1-dependent symplectic extension occurs concurrently with late-p1 formation. (A-C) Schematics of the transverse sections shown in D-I, illustrating ectoderm (blue), endoderm (orange), cartilage (green), somatic tissue (gray) and eye (dark gray). (D-I) Transverse view of confocal stacks, showing WT late-p1 formation between 36 and 72 hpf (D-F, arrowhead), which fails (asterisk) in fras1 mutants (G-I). (J,K) Measurements of (J) endoderm-ectoderm distances and (K) Sy lengths, taken from the same fish. (J) Minimum distance between endoderm and ectoderm measured as illustrated (blue lines in D-I) on randomly selected fish. Endoderm-ectoderm distance decreases in WT fish but remains relatively constant in fras1 mutants. (K) Symplectic length, as measured from above the center of interhyal to the anterior tip of the symplectic (orange lines in L,M). At 36 hpf, symplectic cartilage precursors do not protrude beyond the bulk of the second arch sox9a:EGFP expression, so 36-hpf ‘Sy length’ is measured from the anterior edge of second arch sox9a:EGFP expression to its center. (L,M) Confocal section of 72-hpf symplectic cartilage, illustrating Sy length measurements (orange lines); oriented anterior to left, dorsal up. Error bars show mean ± 1.96 times the s.e. Scale bars: 100 μm (in I for A-I; in L for L,M).
|
