
Fig. 7
- ID
- ZDB-IMAGE-120803-7
- Genes
- Publication
- Talbot et al., 2012 - fras1 shapes endodermal pouch 1 and stabilizes zebrafish pharyngeal skeletal development
- All Figures
- Figures for Talbot et al., 2012
|
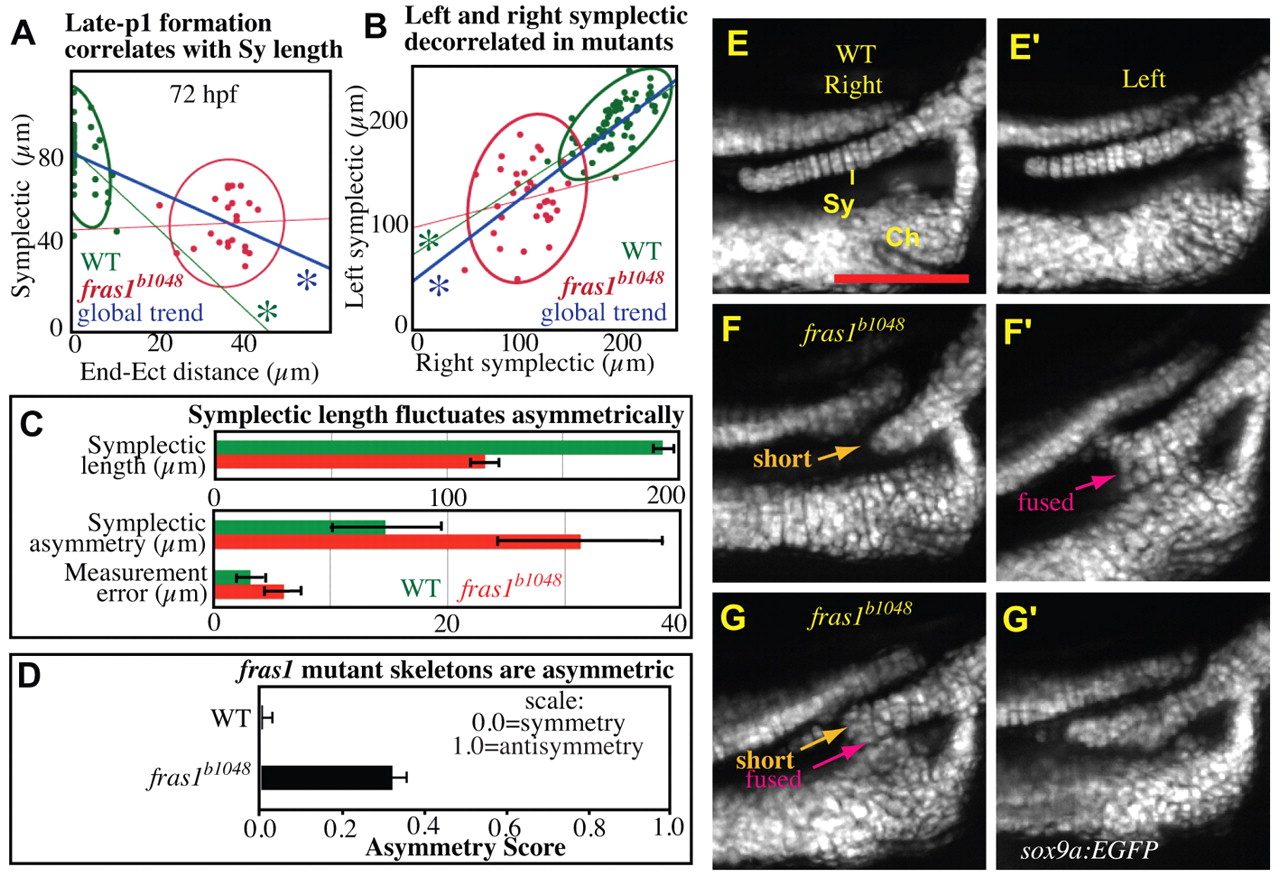
Fig. 7 Skeletal phenotypes fluctuate asymmetrically in fras1 mutants. (A) Plot of 72-hpf right symplectic length versus right endoderm to ectoderm distance, measured as in Fig. 4, with grouped 95% density ellipses. Linear regression reveals that significant correlation (asterisk) between endoderm-ectoderm distances and symplectic length exists in the grouped data, and in WT fish, but not fras1 mutants. All fras1 mutant fish show endoderm-ectoderm distance defects; however, fras1 mutant symplectic lengths are sometimes within the WT range. (B,C) Symplectic length analysis on fish live-imaged at 7.5 dpf. For each side, symplectic length was measured twice, then averaged. (B) Plot of left versus right symplectic length, with grouped 95% density ellipses. In fras1 mutants, linear regression does not reveal a significant correlation between left and right symplectic lengths. (C) fras1 mutants show fluctuating asymmetry, twofold higher than WT. This increase in fluctuating asymmetry is much larger than can be accounted by measurement error. Asymmetry is the absolute value of length differences between sides. Measurement error is estimated as the difference between paired measurements on one side of a fish. (D) Overall skeletal asymmetry of 7.5-dpf fish, calculated as A=(|Sy shortl-r| + |Sy-Ch fusionl-r| + |Me-Pq fusionl-r|) / 3N. (E-G′) Second arch joint region of right (E-G) and left (E′-G′) individuals imaged live at 7.5 dpf; anterior to left, dorsal up. Compared with WT fish (E,E′), fras1 mutant phenotypes are often asymmetric (F-G′). For instance, a fish presenting a short, but unfused, symplectic cartilage on one side (F) also shows an extended, but fused, symplectic cartilage on the opposite side (F′). Conversely, the ‘short’ and ‘fused’ symplectic phenotypes (G) can be found on one side of a fish that presents only subtle defects (G′) on the opposite side. Error bars show mean ± 1.96 times the s.e. Scale bar: 100 μm.