
- Title
-
Characterization and regulation of the hb9/mnx1 beta-cell progenitor specific enhancer in zebrafish
- Authors
- Arkhipova, V., Wendik, B., Devos, N., Ek, O., Peers, B., and Meyer, D.
- Source
- Full text @ Dev. Biol.
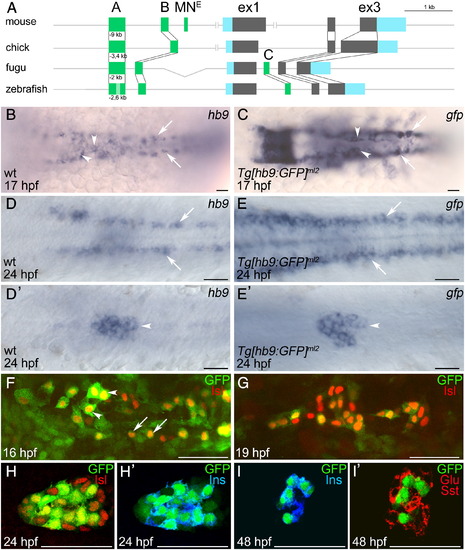
Motoneuron and beta-cell specific GFP expression in Tg[hb9:GFP]ml2 embryos. (A) Schematic representation of the hb9 gene from different species. Highlighted are conserved non-coding regions (dark green), and exons (coding sequences in grey, untranslated regions in blue). (B–I2) In situ hybridization analysis comparing mRNA expression of hb9 (B, D, D2) and gfp (C, E, E2) in Tg[hb9:GFP]ml2 embryos at 17 hpf (B, C) and 24 hpf (D, E) reveals similar pattern in motoneurons and ventral interneurons (B–E, white arrows) and pancreas (B, C, white arrowheads). Asterisk in C marks ectopic gfp expression in rhombomere. D2, E2 show different focal planes of the embryos shown in D, E. (F–I) Confocal image projections of Tg[hb9:GFP]ml2 embryos labelled with GFP (green) and islet antibodies (red) at 16 hpf (F), 19 hpf (G) and 24 hpf (H) show overlapping expression of GFP and islet proteins in motoneurons (arrows) and in a subset of endocrine cells (arrowheads). (H–I2) Confocal image stacks of Tg[hb9:GFP]ml2 embryos labelled with antibodies for GFP and pancreatic hormones at 24 hpf (H2) and 48 hpf (I, I2) show that GFP overlaps with insulin (blue in H2, I) but not with glucagon (Glu) and somatostatin (Sst) (Glu + Sst in red, I2). Embryos are shown in dorsal (B–E) or ventral (F–I) view with anterior to the left. Scale bars in all figures correspond to 50 μm. EXPRESSION / LABELING:
|
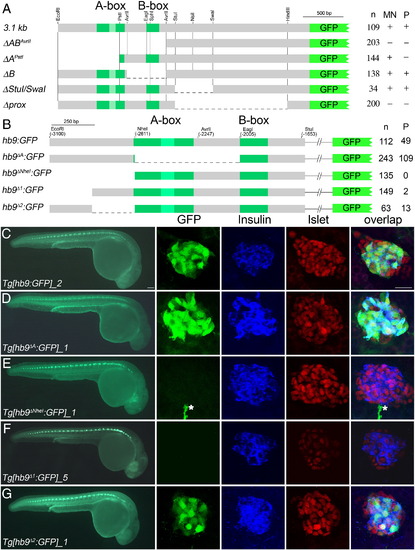
Pancreas specific GFP expression in Tg[hb9:GFP] embryos requires distal non-conserved hb9 promoter sequences. (A) Scheme of non-Tol2 hb9-reporter constructs (left) and results of the transient reporter assay (right, indicated are the numbers (n) of embryos showing presence (+) or absence (-) of GFP signal in spinal cord (SC) and pancreas (P)). (B) Scheme of Tol2 hb9-reporter constructs (left) and results of transient reporter assays (right, indicated are the numbers of GFP positive embryos (n) and of embryos with GFP positive beta-cell (P)). (C–G) GFP expression in representative transgenic lines at 28 hpf in whole embryos (left panel) and in fixed tissue (right panel) stained with antibodies for GFP (green), insulin (blue) and islet (red). The right panel shows confocal image projections and the corresponding overlays (white asterisk in E marks a motor axon). Pancreatic GFP expression is found for reporter constructs lacking either the A-box (Tg[hb9-A:GFP], C) or the 249 bp flanking the A-box (Tg[hb9-2:GFP], F), but not for constructs lacking the most distal 229 bp (Tg[hb9-NheI:GFP], D; Tg[hb9-1:GFP], E). Scale bar corresponds to 100 µm (whole embryos) and 20 μm (confocal image stacks). For further details on the GFP expression in all transgenic reporter lines see Supplementary Table 1. EXPRESSION / LABELING:
|
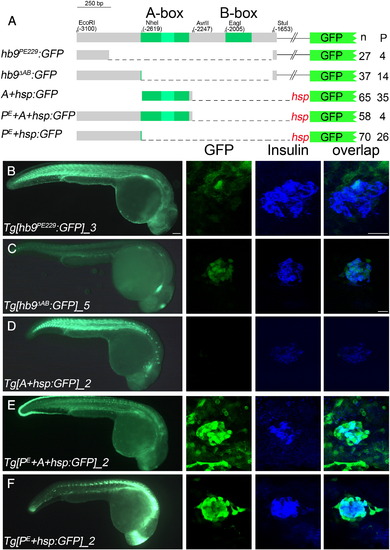
478 bp of proximal hb9 promoter sequences are sufficient for beta-cell specific regulation. (A) Overview of transient GFP reporter experiments with a scheme of deletion constructs on the left and corresponding numbers of GFP positive embryos (n) and embryos expressing GFP in the pancreas (P) on the right side. (B–F) GFP expression in representative transgenic lines at 28 hpf in whole embryos (left panel) and in fixed tissue (right panel) stained with antibodies for GFP (green) and insulin (blue). The right panel shows confocal image projections and the corresponding overlays (right-most panel). Scale bar corresponds to 100 μm (whole embryos) and 20 μm (confocal image stacks). For more details see also Supplementary Table 2. EXPRESSION / LABELING:
|
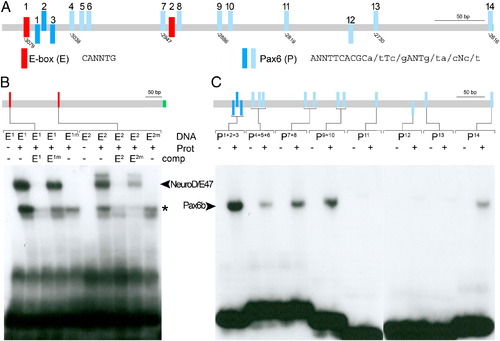
In vitro binding of NeuroD and Pax6b to PE specific sequence motives. (A) Schematic representation of potential binding sites for the transcription factors NeuroD (E-box in red) and Pax6 (blue) within the hb9 pancreas enhancer as revealed by bioinformatic sequence analyses. Pax6 sites with a core match between 0.76 and 0.9 are shown in light blue, and sites with a core match between 0.9 and 1 are shown in dark blue (core = TCACG). Orientation of Pax6 sites is indicated by position relative to the line (above: positive DNA strand; below: negative DNA). (B) EMSA studies show binding of in vitro synthesized NeuroD/E47 dimers (Prot) to oligonucleotides (DNA) spanning the E-boxes (E1, E2) but not to corresponding oligonucleotides with mutated E boxes (E1m and E2m). Competitor assays with unlabelled oligonucleotides (comp, as indicated) revealed efficient competition by E1 and E2 but not by E1m and E2m. Notably, unlabelled E2m reduced binding of labelled E2 to NeuroD/E47, suggesting that E2 binds NeuroD/E47 with lower affinity as compared to E1. Bands indicated by the asterisk presumably correspond to monomeric DNA–protein complexes. (C) EMSA studies with in vitro synthesized Pax6b protein (Prot) and oligonucleotides spanning individual or multiple potential Pax6b sites (as indicated). EMSA signals could be detected for P1 + 2 + 3, P4 + 5 + 6, P7 + 8, P9 + 10, P14 but not for P11, P12 and P13 (positions of protein-bound DNAs are indicated by arrowhead). |
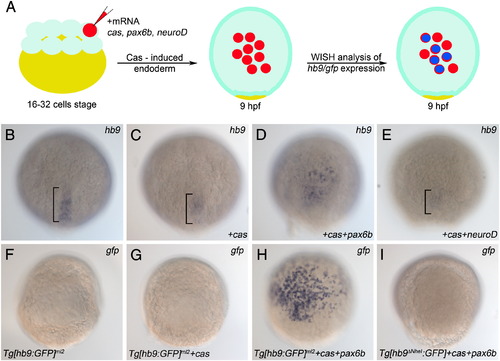
Pax6b but not NeuroD is sufficient to induce endodermal hb9 expression. (A) Schematic of the induction experiment: One cell of a 16–32 cell embryo stage was injected with mRNA encoding either Cas alone or a mixture of mRNAs encoding Cas together with NeuroD or Pax6b. Injected embryos were fixed 8 h later (9 hpf) and analysed by mRNA in situ hybridisation. (B–E) Expression of hb9 mRNA in uninjected control embryos (B) and in embryos injected with cas (C), cas/paxb6 (D) and cas/neuroD (E) mRNA. Note that only cas/pax6b mRNA injected embryos (D) show ectopic hb9 signals. Signals in posterior notochord (bracket in B, C, E) represent endogenous hb9 expression, while reduced signals in the cas (C), and cas/neuroD (E) injected embryos correlate with the developmental delay caused by the injection. (F–I) Expression of gfp mRNA in transgenic reporter lines in which gfp is controlled by PE-containing (Tg[hb9:GFP]ml2 in F–H) or PE-deleted (Tg[hb9-NheI:GFP] in I) hb9 promoter-sequences. Uninjected (F) and cas-mRNA injected Tg[hb9:GFP]ml2 embryos (G) show no gfp signals while injection of cas/pax6b mRNA results in a robust gfp induction (H). Lack of gfp signals in cas/pax6b injected Tg[hb9-NheI:GFP] shows that gfp induction by Pax6b is PE-dependent. EXPRESSION / LABELING:
|
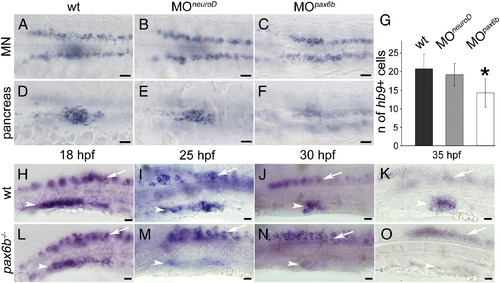
hb9 expression is initiated but not maintained in Pax6b deficient embryos. (A–F) Expression of hb9 mRNA at 24 hpf in motoneurons (MN in A, C, E) and in the pancreatic islet (pancreas in B, D, F) of uninjected wild type (wt) embryos (A, B) and embryos injected with neuroD (C, D) or pax6b morpholinos (E, F). Note that pancreatic hb9 expression is reduced in pax6b but not in neuroD morphants while motoneuron specific expression in the same embryos is not affected. Embryos are shown in dorsal view with anterior to the left. Scale bars in all figures correspond to 20 µm. (G) Number of hb9 positive cells in the pancreas of the wild type (wt), neuroD (MOneuroD) and pax6b (MOpax6b) morphants. (p-value for neuroD morphants 0.19429, p-value for pax6b morphants 0.00467). (H–O) hb9 expression in wild type embryos (H, I, J, K) and pax6b mutants (L, M, N, O) at 18 hpf (H, L), 25 hpf (I, M), 30 hpf (J, N) and 35 hpf (K, O). Note that hb9 expression in pancreas (white arrowhead) decreases during development in mutants, whereas expression in motoneurons (white arrow) is not affected. Embryos are shown in lateral view with anterior to the left. Scale bars in all figures correspond to 20 μm. EXPRESSION / LABELING:
|
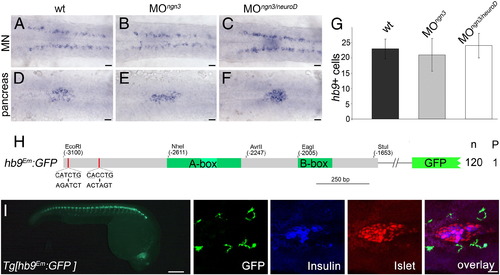
E-box binding proteins but not Ngn3 and NeuroD are required for beta-cell specific hb9 expression. (A–F) Similar expression of hb9 mRNA at 24 hpf in motoneurons (MN in A–C) and in the pancreatic islet (pancreas in D–F) of uninjected wild type (wt) embryos (A, D) and embryos injected with ngn3 (B, E) or a combination of ngn3 and neuroD morpholinos (C, F). Different focus planes of the same embryos are shown in dorsal view with anterior to the left. (G) Countings of hb9 positive cells in the pancreas of the wild type (wt, n = 21), ngn3 (MOngn3, n = 32) and ngn3/neuroD (MOngn3/neuroD, n = 22) morphants at 24 hpf. (H) Schematic drawing of the hbEm:GFP construct in which both E-boxes (red line) were mutated by site-directed mutagenesis (origin and mutated sequences are shown with consensus sequences being underlined). Numbers on the right summarize the results of transient reporter assays in which a single embryo out of 120 GFP positive embryos (n) showed reporter expression within the pancreas (P). (I) GFP expression in Tg[hb9Em:GFP] embryos at 28 hpf in whole embryos and in embryos stained with antibodies for GFP (green, expression corresponds to motor axons), insulin (blue) and islet (red). The right images shown are confocal image projections with an overlay at the right. Scale bar corresponds to 100 μm (live embryo in I) and 20 μm (A–F, confocal images in I). EXPRESSION / LABELING:
|
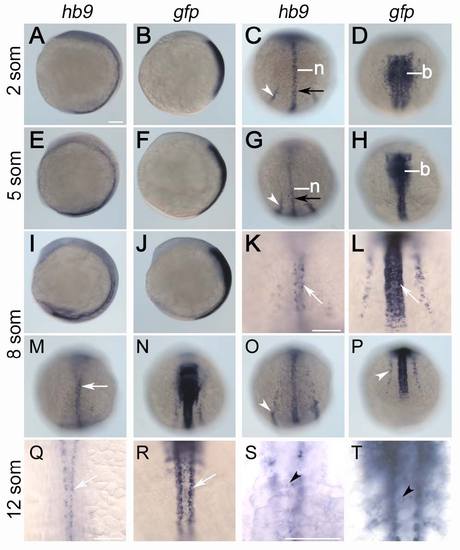
Comparison of early hb9 and gfp expression in Tg[hb9:GFP]ml2. Stains are shown at 2 (A-D), 5 (E-H), 8 (I-P) and 12 somite stage (Q-T). Expression of hb9 is restricted to notochord (n), posterior endoderm (black arrow) and posterior intermediate mesoderm (white arrowhead), motoneurons (white arrow) and at 12 stage also to beta-cell progenitors (black arrowhead). Differently, gfp mRNA in early Tg[hb9:GFP]Lml2 embryos is expressed in the entire hindbrain (b), the anterior spinal cord and in intermediate mesoderm. At 12 somites stage gfp expression in the trunk marks anterior somites, beta-cells and ventral spinal neurons. Embryos are shown from lateral (A, B, E, F, I, J) or dorsal (C, D, G, H, K-N, Q-T) with anterior pole to the top or from posterior with the dorsal side up (O, P). Scale bars correspond to 100 μm. |
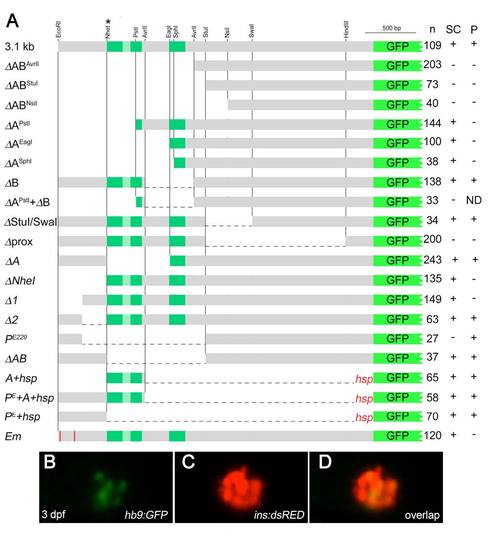
Characterization of 3.1 kb of upstream hb9 promoter in zebrafish (A). Scheme of deletion constructs that were tested in transient and transgenic GFP reporter assays in 24 hpf embryos. Indicated are the number of GFP expressing embryos (n) and the presence (+) or absence (-) of GFP expression in spinal cord (SC) and pancreas (P). NheI* indicates an additional NheI site that was introduced by site-directed mutagenesis. (B-D) Confocal image projection of a Tg[ins:dsRED] embryo showing mosaic GFP expression in beta-cells following injection of hb9:GFP DNA. |
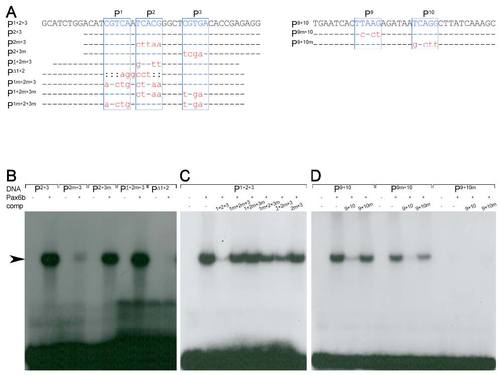
Pax6b binding properties of the sequence motives P1-3 and P9-10 (A)Sequence of oligonucleotides used in the EMSA studies (top row). Indicated are the Pax6 core consensus sequences P1, P2, P3, P9 and P10 (blue box, letters in upper case) and nucleotides that were unchanged (line), mutated (red letters in lower case) or deleted (colon) in comparison to the genomic sequence. (B-D) Radiograms of EMSA studies with corresponding 32P-labeled oligonucleotides (DNA, as indicated), Pax6b protein and nonlabelled competitor DNA (comp, as indicated). (B) Weak or missing signals (arrow) for P2m+3, PΔ1+2 and strong signals for P2+3, P2+3m and P1+2m+3 suggest that Pax6b binds with high affinity to P1 and P2 but not to P3. (C) The inefficient competition of all mutated oligonucleotides in comparison to P1+2+3 shows that highest affinity binding requires the presence of both sites, P1 and P2. (D) Missing signals for and inefficient competition by P9+10m show that Pax6b binds with high affinity to P10 but not to P9. |
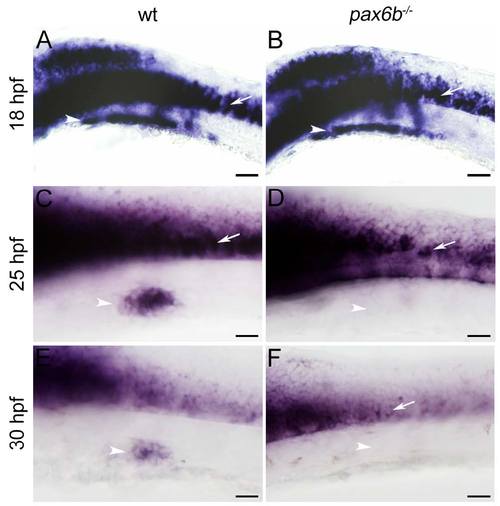
gfp expression in Tg[hb9:GFP]ml2 is initiated but not maintained in Pax6b deficient embryos. (A-F) gfp mRNA expression in Tg[hb9:GFP]ml2 control embryos (A, C, E) and pax6bsa0086 mutant embryos (B, D, F) at 18 hpf (A,B), 25 hpf (C,D) and 30 hpf (E,F). Pancreatic gfp expression (white arrowhead) is present at 18 hpf but missing in older embryos sinitin (white arrowhead). Expression in the spinal cord (white arrow) is not affected by the pax6b mutation. Embryos are shown in lateral view with anterior to the left. Scale bars in all figures correspond to 50 μm. |
Reprinted from Developmental Biology, 365(1), Arkhipova, V., Wendik, B., Devos, N., Ek, O., Peers, B., and Meyer, D., Characterization and regulation of the hb9/mnx1 beta-cell progenitor specific enhancer in zebrafish, 290-302, Copyright (2012) with permission from Elsevier. Full text @ Dev. Biol.