
|
Fig. S1
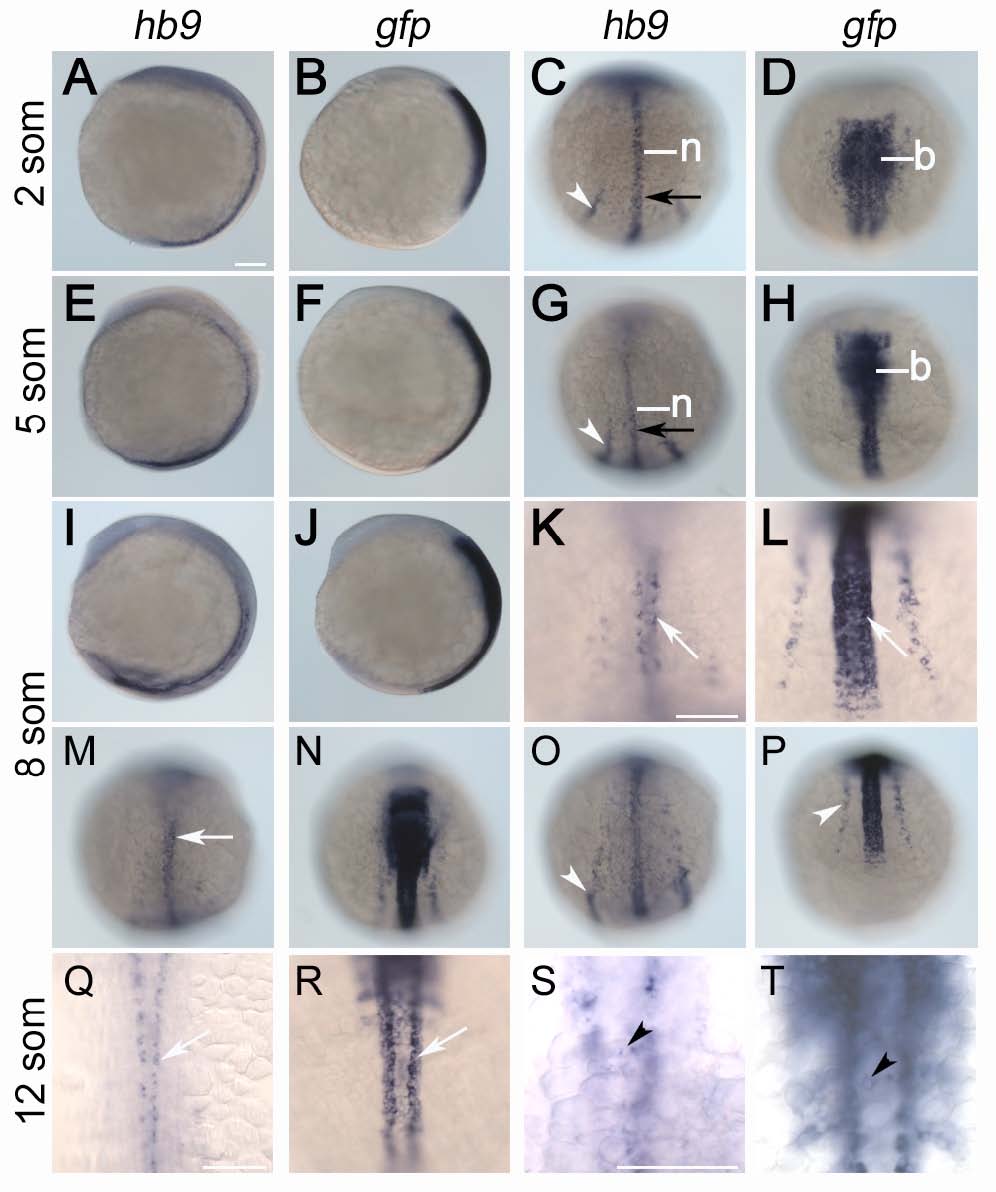
Comparison of early hb9 and gfp expression in Tg[hb9:GFP]ml2.
Stains are shown at 2 (A-D), 5 (E-H), 8 (I-P) and 12 somite stage (Q-T). Expression of hb9 is restricted to notochord (n), posterior endoderm (black arrow) and posterior intermediate mesoderm (white arrowhead), motoneurons (white arrow) and at 12 stage also to beta-cell progenitors (black arrowhead). Differently, gfp mRNA in early Tg[hb9:GFP]Lml2 embryos is expressed in the entire hindbrain (b), the anterior spinal cord and in intermediate mesoderm. At 12 somites stage gfp expression in the trunk marks anterior somites, beta-cells and ventral spinal neurons. Embryos are shown from lateral (A, B, E, F, I, J) or dorsal (C, D, G, H, K-N, Q-T) with anterior pole to the top or from posterior with the dorsal side up (O, P). Scale bars correspond to 100 μm.
Reprinted from Developmental Biology, 365(1), Arkhipova, V., Wendik, B., Devos, N., Ek, O., Peers, B., and Meyer, D., Characterization and regulation of the hb9/mnx1 beta-cell progenitor specific enhancer in zebrafish, 290-302, Copyright (2012) with permission from Elsevier. Full text @ Dev. Biol.