
- Title
-
Characterization of a Weak Allele of Zebrafish cloche Mutant
- Authors
- Ma, N., Huang, Z., Chen, X., He, F., Wang, K., Liu, W., Zhao, L., Xu, X., Liao, W., Ruan, H., Luo, S., and Zhang, W.
- Source
- Full text @ PLoS One
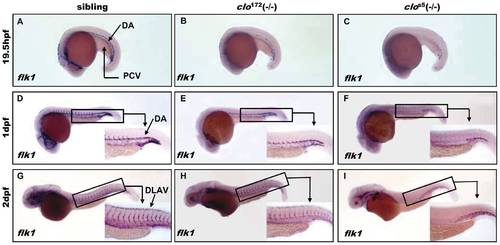
Expression of flk1 in clo172 and clos5 mutants. (A–I) Whole-mount in situ hybridization of flk1 expression at 19.5 hpf in sibling (A), clo172 mutant (B) and clos5 mutant (C) embryos, 1 dpf stage in sibling (D), clo172 mutant (E) and clos5 mutant (F) embryos, and 2 dpf stage in sibling (G), clo172 mutant (H) and clos5 mutant (I) embryos. Embryos are shown with anterior to the left and dorsal up. Inserts are high magnification (20×) of the corresponding boxed regions. DA: dorsa aorta; PCV: posterior cardinal vein; DLAV: dorsal longitudinal anastomotic vessels. EXPRESSION / LABELING:
PHENOTYPE:
|
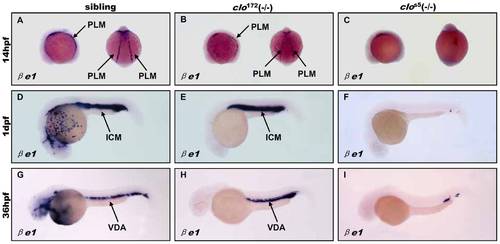
Dynamic βe1 expression during primitive hematopoiesis in clo172 and clos5 mutant embryos. (A–I) Whole-mount in situ hybridization of βe1 expression in sibling embryos at 14 hpf (A), 1 dpf (D) and 36 hpf (G), and clo172 mutant embryos at 14 hpf (B), 1 dpf (E) and 36 hpf (H), and clos5 mutant embryos at 14 hpf (C), 1 dpf (F) and 36 hpf (I). Embryos are shown with anterior to the left and dorsal up. PLM: posterior lateral mesoderm; ALM: anterior lateral mesoderm; ICM: intermediate cell mass; VDA: ventral wall of dorsa aorta. EXPRESSION / LABELING:
PHENOTYPE:
|
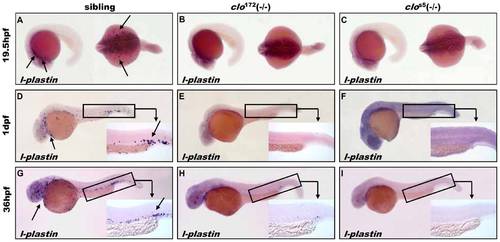
Primitive Myelopoiesis in clo172 and clos5 mutant embryos. (A–I) Myeloid lineage marker l-plastin expression at 19.5 hpf(A: the left arrow show anterior cephalic mesoderm, B–C), 1 dpf stage (D: the left arrow show anterior cephalic mesoderm, E–F), and 36 hpf stage (G: the left arrow show anterior cephalic mesoderm H–I) in sibling, clo172 and clos5 mutant embryos. Embryos are shown with anterior to the left and dorsal up. Inserts are high magnification (20×) of the corresponding boxed region (the right arrow show tail region). EXPRESSION / LABELING:
PHENOTYPE:
|
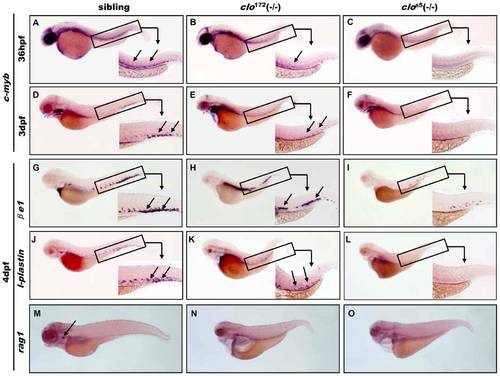
Definitive hematopoiesis in clo172 and clos5 mutant embryos. (A–C) stem cell marker c-myb expression at 36 hpf and 3 dpf stage in wild type (A: arrow show VDA region; D: arrow show PBI region), clo172 (B, E) and clos5 mutant (C, F) embryos.(G–I). WISH of βe1 expression at 4 dpf stage in sibling (G: arrow show PBI region), clo172 (H) and clo mutant (I) embryos. (J–L) WISH to detect l-plastin expression at 4 dpf stage in sibling (J: arrow show PBI region), clo172 (K) and clos5 mutant (L) embryos. (M–O)WISH of T lymophcyte marker rag1 expression at 4 dpf stage in sibling (M: arrow show thymus), clo172 (N) and clos5 mutant (O) embryos. Embryos are shown with anterior to the left and dorsal up. Inserts are high magnification (20×) of the corresponding boxed regions. VDA: ventral wall of dorsa aorta; PBI: posterior blood island. |
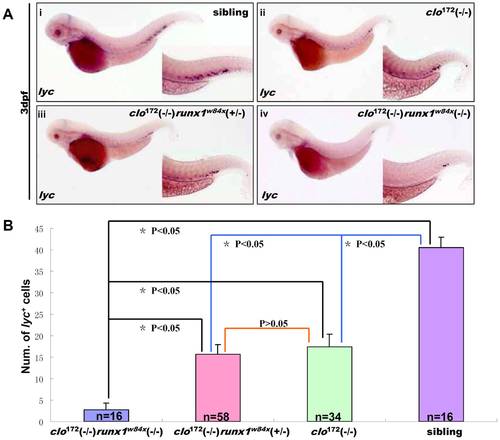
Analysis of the origin of definitive myeloid cells in clo172 mutant. (A, B) lyc expression pattern at 3 dpf runx1/clo172 double mutant (A). WISH of lyc expression in siblings (A–i), clo172 mutant (A–ii), clo172 (-/-) runx1 (+/-) w84x (A-iii), double homozygous mutant (A–iv). Histogram of lyc+ cells number (means) in siblings(B, purple column), clo172 mutant (B, green column), clo172 (-/-) runx1 (+/-)w84x (B, pink column) and double homozygous mutant (B, blue column). There are significant differences between double mutant and other groups (*p<0.05), but no difference between clo172 mutant and clo172 (-/-) runx1 (+/-) w84x group (p>0.05). The corresponding case numbers were shown by n in column. EXPRESSION / LABELING:
PHENOTYPE:
|
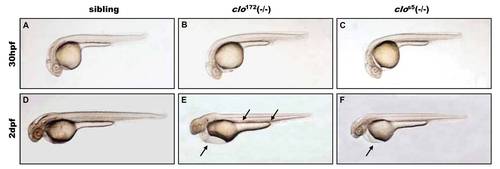
Dynamic morphological changes of clo172 and clos5 mutant. (A–F) Lateral view of morphological changes 30 hpf stage of sibling (A), clo172 (B), clos5 mutant (C) and 2 dpf stage of sibling (D), clo172 (E: arrow show edema heart and red blood cell in VDA region), clos5 mutant (F: arrow show edema heart). |
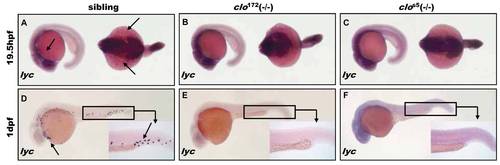
Expression of lyc during primitive hematopoiesis in clo172 and clos5 mutant embryos. (A–F) Whole-mount in situ hybridization of lyc expression at 19.5 hpf (A: arrow show anterior cephalic mesoderm, B–C), 1 dpf stage (D: the left arrow show anterior cephalic mesoderm, E–F) in sibling, clo172 mutant and clos5 mutant embryos. Embryos are shown with anterior to the left and dorsal up. Inserts are high magnification (20×) of the corresponding boxed regions. |
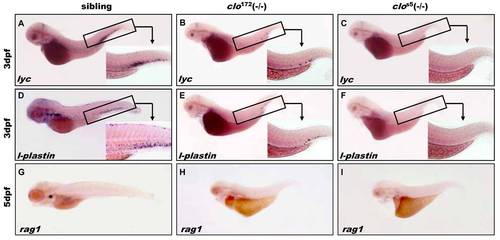
Definitive myelopoiesis and rag1 expression pattern in clo172 and clos5 mutant embryos. l-plastin and lyc expression at 3 dpf in sibling(A, D), clo172 (B, E), clos5 mutant (C, F). rag1 expression at 5 dpf in sibling(G), clo172 (H), clos5 mutant (I). Inserts are high magnification (20×) of the corresponding boxed regions (the right arrow show tail region). |