
FIGURE
Fig. 3
- ID
- ZDB-FIG-111214-32
- Publication
- Ma et al., 2011 - Characterization of a Weak Allele of Zebrafish cloche Mutant
- Other Figures
- All Figure Page
- Back to All Figure Page
Fig. 3
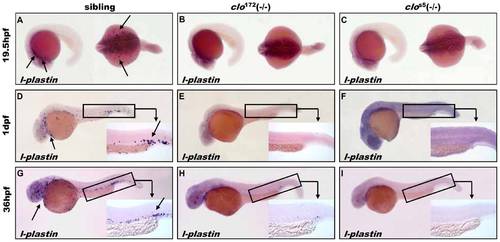
Primitive Myelopoiesis in clo172 and clos5 mutant embryos. (A–I) Myeloid lineage marker l-plastin expression at 19.5 hpf(A: the left arrow show anterior cephalic mesoderm, B–C), 1 dpf stage (D: the left arrow show anterior cephalic mesoderm, E–F), and 36 hpf stage (G: the left arrow show anterior cephalic mesoderm H–I) in sibling, clo172 and clos5 mutant embryos. Embryos are shown with anterior to the left and dorsal up. Inserts are high magnification (20×) of the corresponding boxed region (the right arrow show tail region). |
Expression Data
| Gene: | |
|---|---|
| Fish: | |
| Anatomical Terms: | |
| Stage Range: | 20-25 somites to Prim-25 |
Expression Detail
Antibody Labeling
Phenotype Data
| Fish: | |
|---|---|
| Observed In: | |
| Stage Range: | 20-25 somites to Prim-25 |
Phenotype Detail
Acknowledgments
This image is the copyrighted work of the attributed author or publisher, and
ZFIN has permission only to display this image to its users.
Additional permissions should be obtained from the applicable author or publisher of the image.
Full text @ PLoS One