
Image
|
Figure Caption
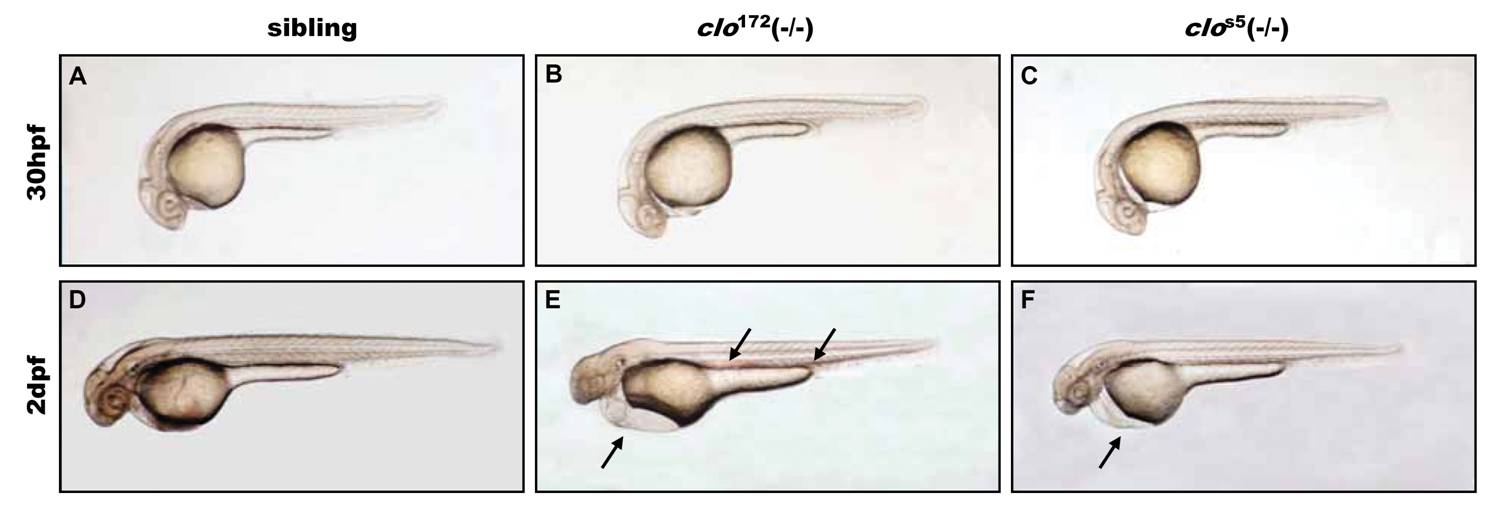
Fig. S1 Dynamic morphological changes of clo172 and clos5 mutant. (A–F) Lateral view of morphological changes 30 hpf stage of sibling (A), clo172 (B), clos5 mutant (C) and 2 dpf stage of sibling (D), clo172 (E: arrow show edema heart and red blood cell in VDA region), clos5 mutant (F: arrow show edema heart).
Figure Data
Acknowledgments
This image is the copyrighted work of the attributed author or publisher, and
ZFIN has permission only to display this image to its users.
Additional permissions should be obtained from the applicable author or publisher of the image.
Full text @ PLoS One