
|
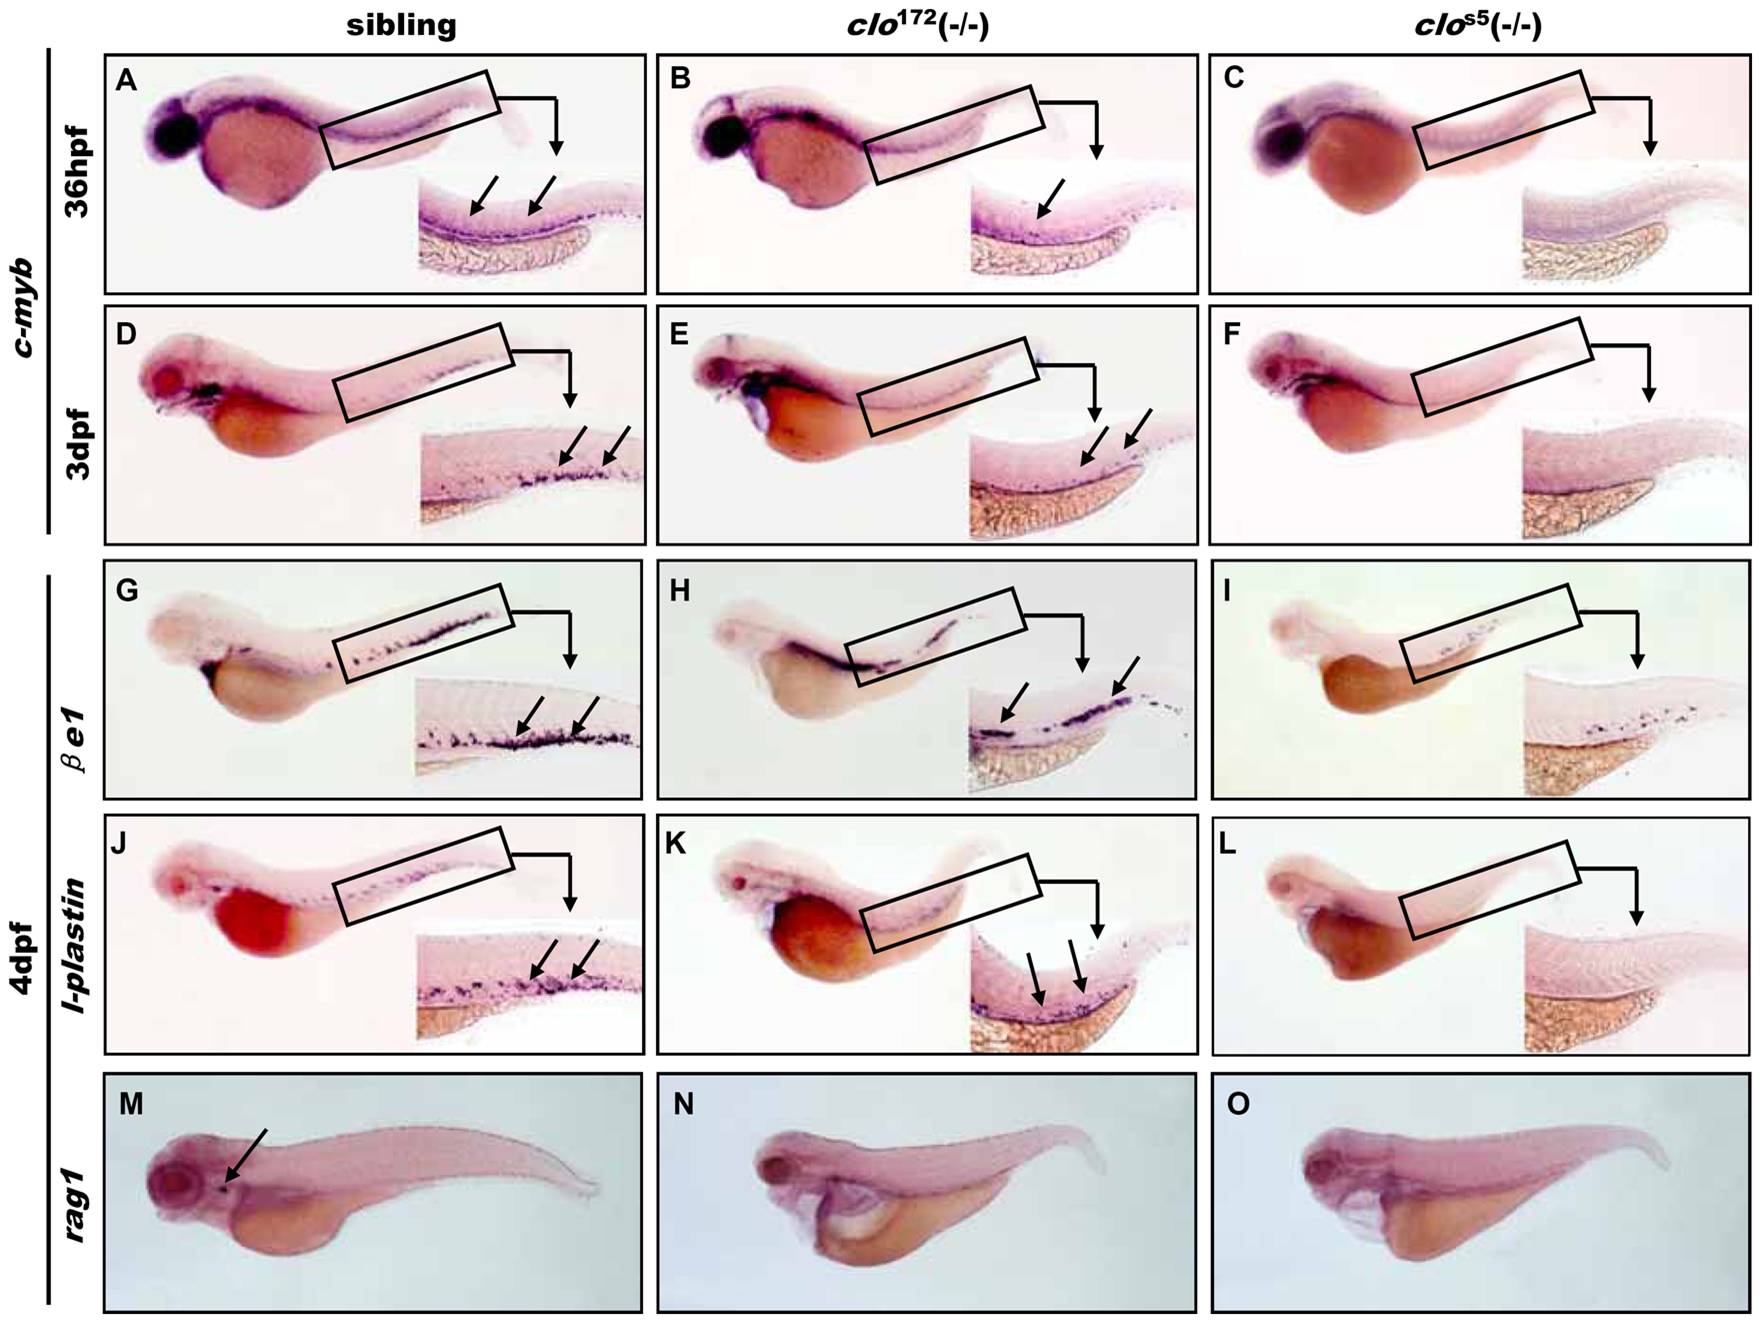
Fig. 4 Definitive hematopoiesis in clo172 and clos5 mutant embryos.
(A–C) stem cell marker c-myb expression at 36 hpf and 3 dpf stage in wild type (A: arrow show VDA region; D: arrow show PBI region), clo172 (B, E) and clos5 mutant (C, F) embryos.(G–I). WISH of βe1 expression at 4 dpf stage in sibling (G: arrow show PBI region), clo172 (H) and clo mutant (I) embryos. (J–L) WISH to detect l-plastin expression at 4 dpf stage in sibling (J: arrow show PBI region), clo172 (K) and clos5 mutant (L) embryos. (M–O)WISH of T lymophcyte marker rag1 expression at 4 dpf stage in sibling (M: arrow show thymus), clo172 (N) and clos5 mutant (O) embryos. Embryos are shown with anterior to the left and dorsal up. Inserts are high magnification (20×) of the corresponding boxed regions. VDA: ventral wall of dorsa aorta; PBI: posterior blood island.