
- Title
-
Tissue-restricted expression of nrf2 and its target genes in zebrafish with gene-specific variations in the induction profiles
- Authors
- Nakajima, H., Nakajima-Takagi, Y., Tsujita, T., Akiyama, S., Wakasa, T., Mukaigasa, K., Kaneko, H., Tamaru, Y., Yamamoto, M., and Kobayashi, M.
- Source
- Full text @ PLoS One
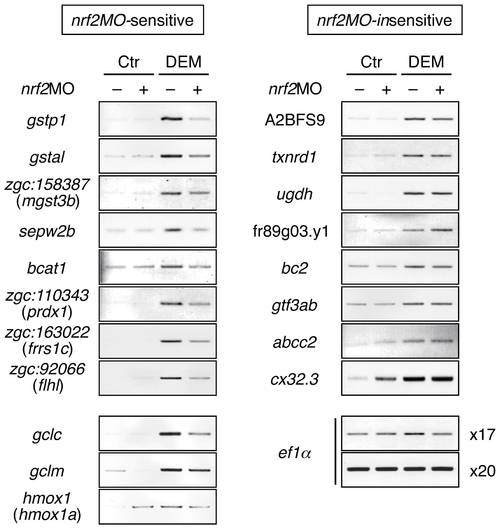
Screening of Nrf2 target genes in zebrafish. DEM-induced expression of candidate genes for Nrf2 target analyzed by RT-PCR. Embryos were injected with or without nrf2MO and treated with or without 100 μM DEM for six hours at 2 hours post-fertilization (hpf) using total RNA from the whole bodies. EXPRESSION / LABELING:
|
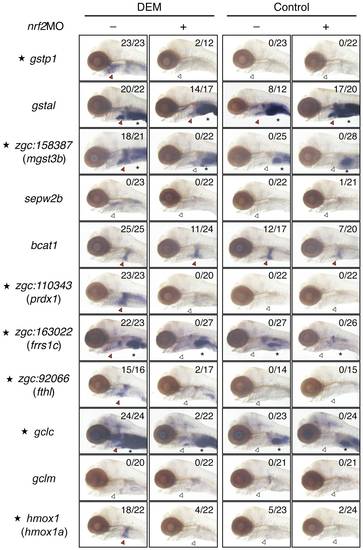
WISH analysis of Nrf2 target genes. Expression of eleven Nrf2 target genes was analyzed by WISH. Embryos were injected with or without nrf2MO and treated with or without 100 μM DEM for six hours (three hours only for hmox1a) at 5 dpf. Lateral views. Numbers indicate the induction positive embryos/tested embryos. Red and white arrowheads indicate positive and negative expression, respectively. Asterisks denote basal expression in the intestine. EXPRESSION / LABELING:
|
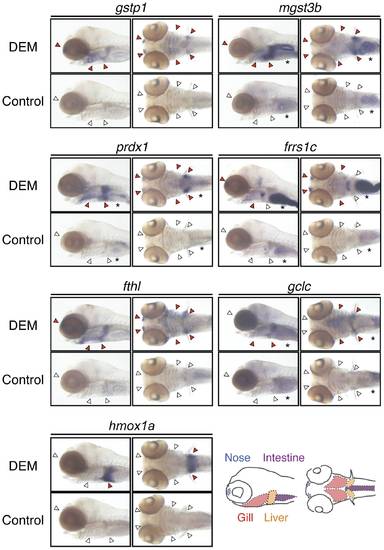
Tissue-restricted induction of Nrf2 target genes. 5-dpf larvae were treated with or without 100 µM DEM for six hours (three hours only for hmox1a) and expression of indicated genes was analyzed by WISH. Lateral and ventral views. Red and white arrowheads indicate positive and negative expression, respectively, of each gene in the nose, gill and liver. Asterisks denote basal expression in the intestine. EXPRESSION / LABELING:
|
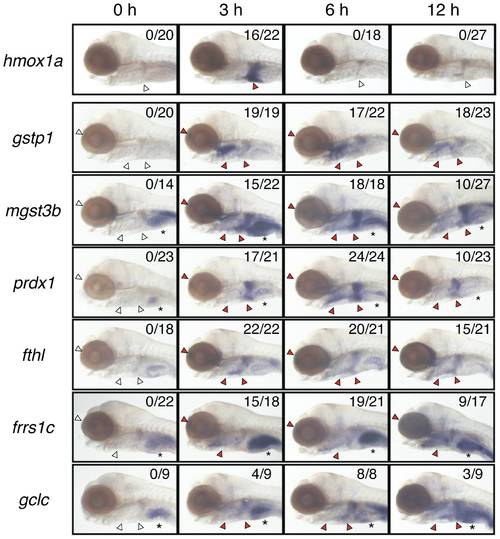
Induction time profiles of Nrf2 target genes. 5-dpf larvae were treated with 100 μM DEM for indicated hours and expression of seven genes was analyzed by WISH. Lateral views. Red and white arrowheads indicate positive and negative expression, respectively, of each gene in the nose, gill and liver. Asterisks denote the basal expression in the intestine. EXPRESSION / LABELING:
|
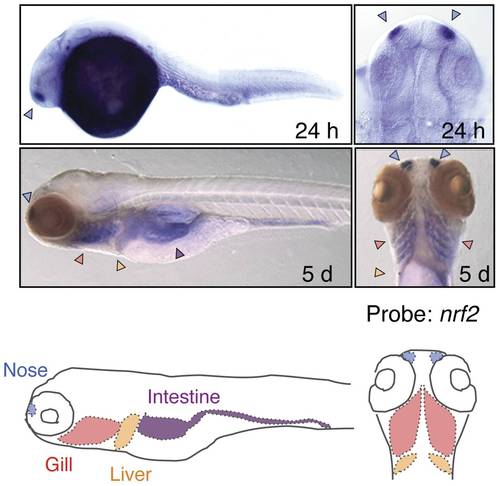
Tissue-specific expression of the Nrf2 gene. Expression of Nrf2 gene in 24-hpf embryos and 5-dpf larvae were analyzed by WISH. Lateral (upper left, lower left), dorsal (upper right), and ventral (lower right) views. Arrowheads in light blue, red and orange indicate expression in the nose, gill and liver. |
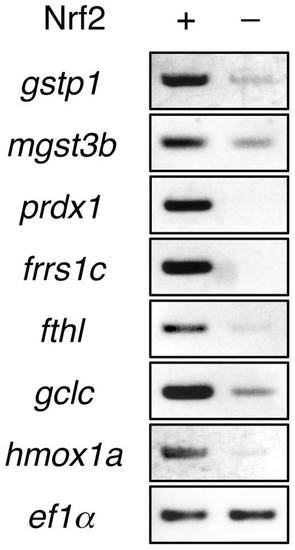
Target gene induction in zebrafish embryos by Nrf2 overexpression. RT-PCR analysis using total RNA from the whole bodies of 30 embryos and specific primers of indicated genes. |
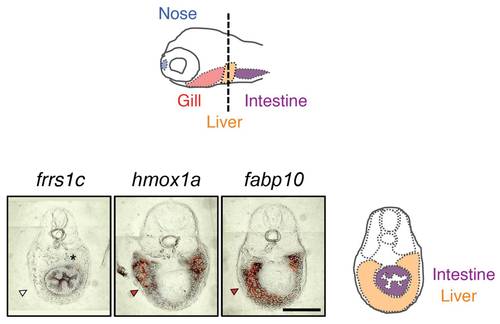
Expression of frrs1c and hmox1c in the liver. Transverse sections of 5-dpf larvae through the trunk at the level of the liver (dotted line). Larvae were treated with (frrs1c, hmox1a) or without (fabp10) 100 μm DEM and analyzed by WISH before sectioning. Red and white arrowheads indicate positive and negative expression, respectively, of each gene in the liver. Asterisk denotes the basal expression in the intestine. Scale bar, 100 μm. |
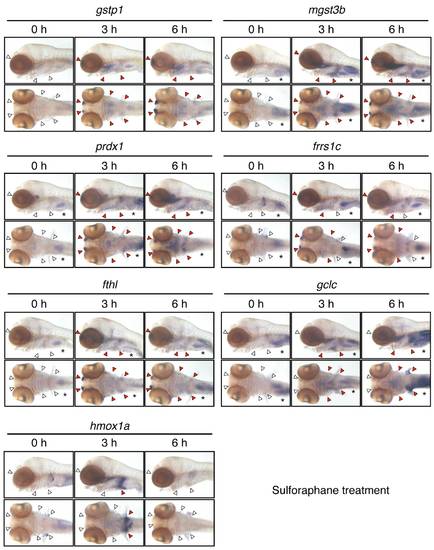
Induction of Nrf2 target genes by sulforaphane. 5-dpf larvae were treated with or without 40 μM sulforaphane for indicated hours and expression of seven Nrf2 target genes was analyzed by WISH. Lateral and ventral views. Red and white arrowheads indicate positive and negative expression, respectively, of each gene in the nose, gill and liver. Asterisks denote basal expression in the intestine. |