
Image
|
Figure Caption
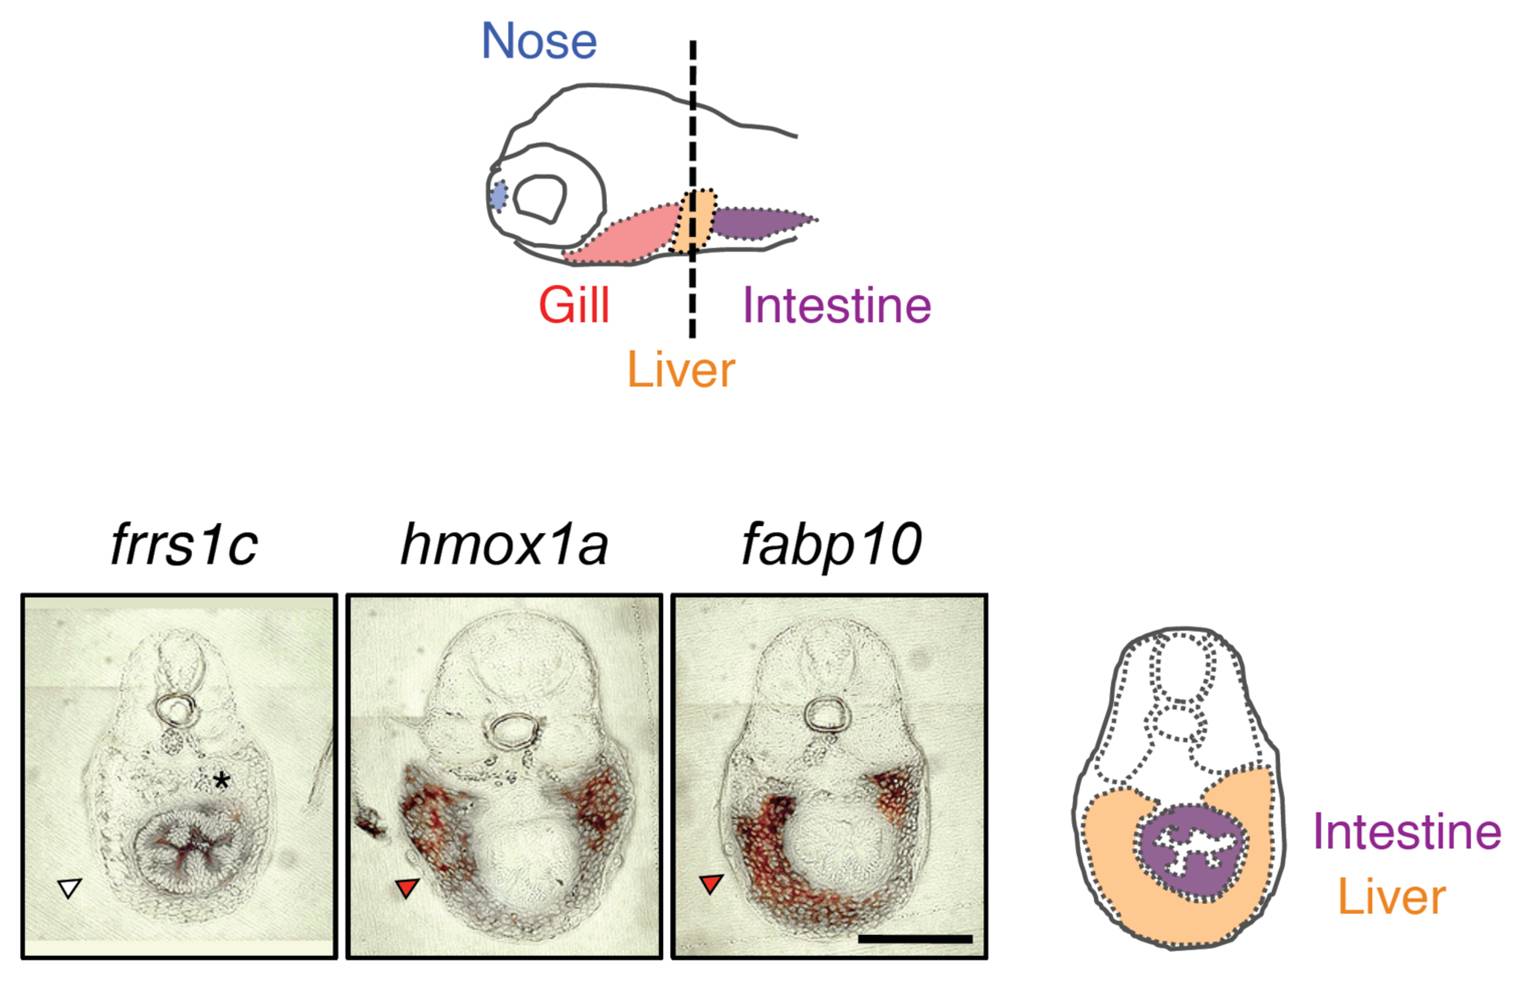
Fig. S11 Expression of frrs1c and hmox1c in the liver. Transverse sections of 5-dpf larvae through the trunk at the level of the liver (dotted line). Larvae were treated with (frrs1c, hmox1a) or without (fabp10) 100 μm DEM and analyzed by WISH before sectioning. Red and white arrowheads indicate positive and negative expression, respectively, of each gene in the liver. Asterisk denotes the basal expression in the intestine. Scale bar, 100 μm.
Acknowledgments
This image is the copyrighted work of the attributed author or publisher, and
ZFIN has permission only to display this image to its users.
Additional permissions should be obtained from the applicable author or publisher of the image.
Full text @ PLoS One