
Image
|
Figure Caption
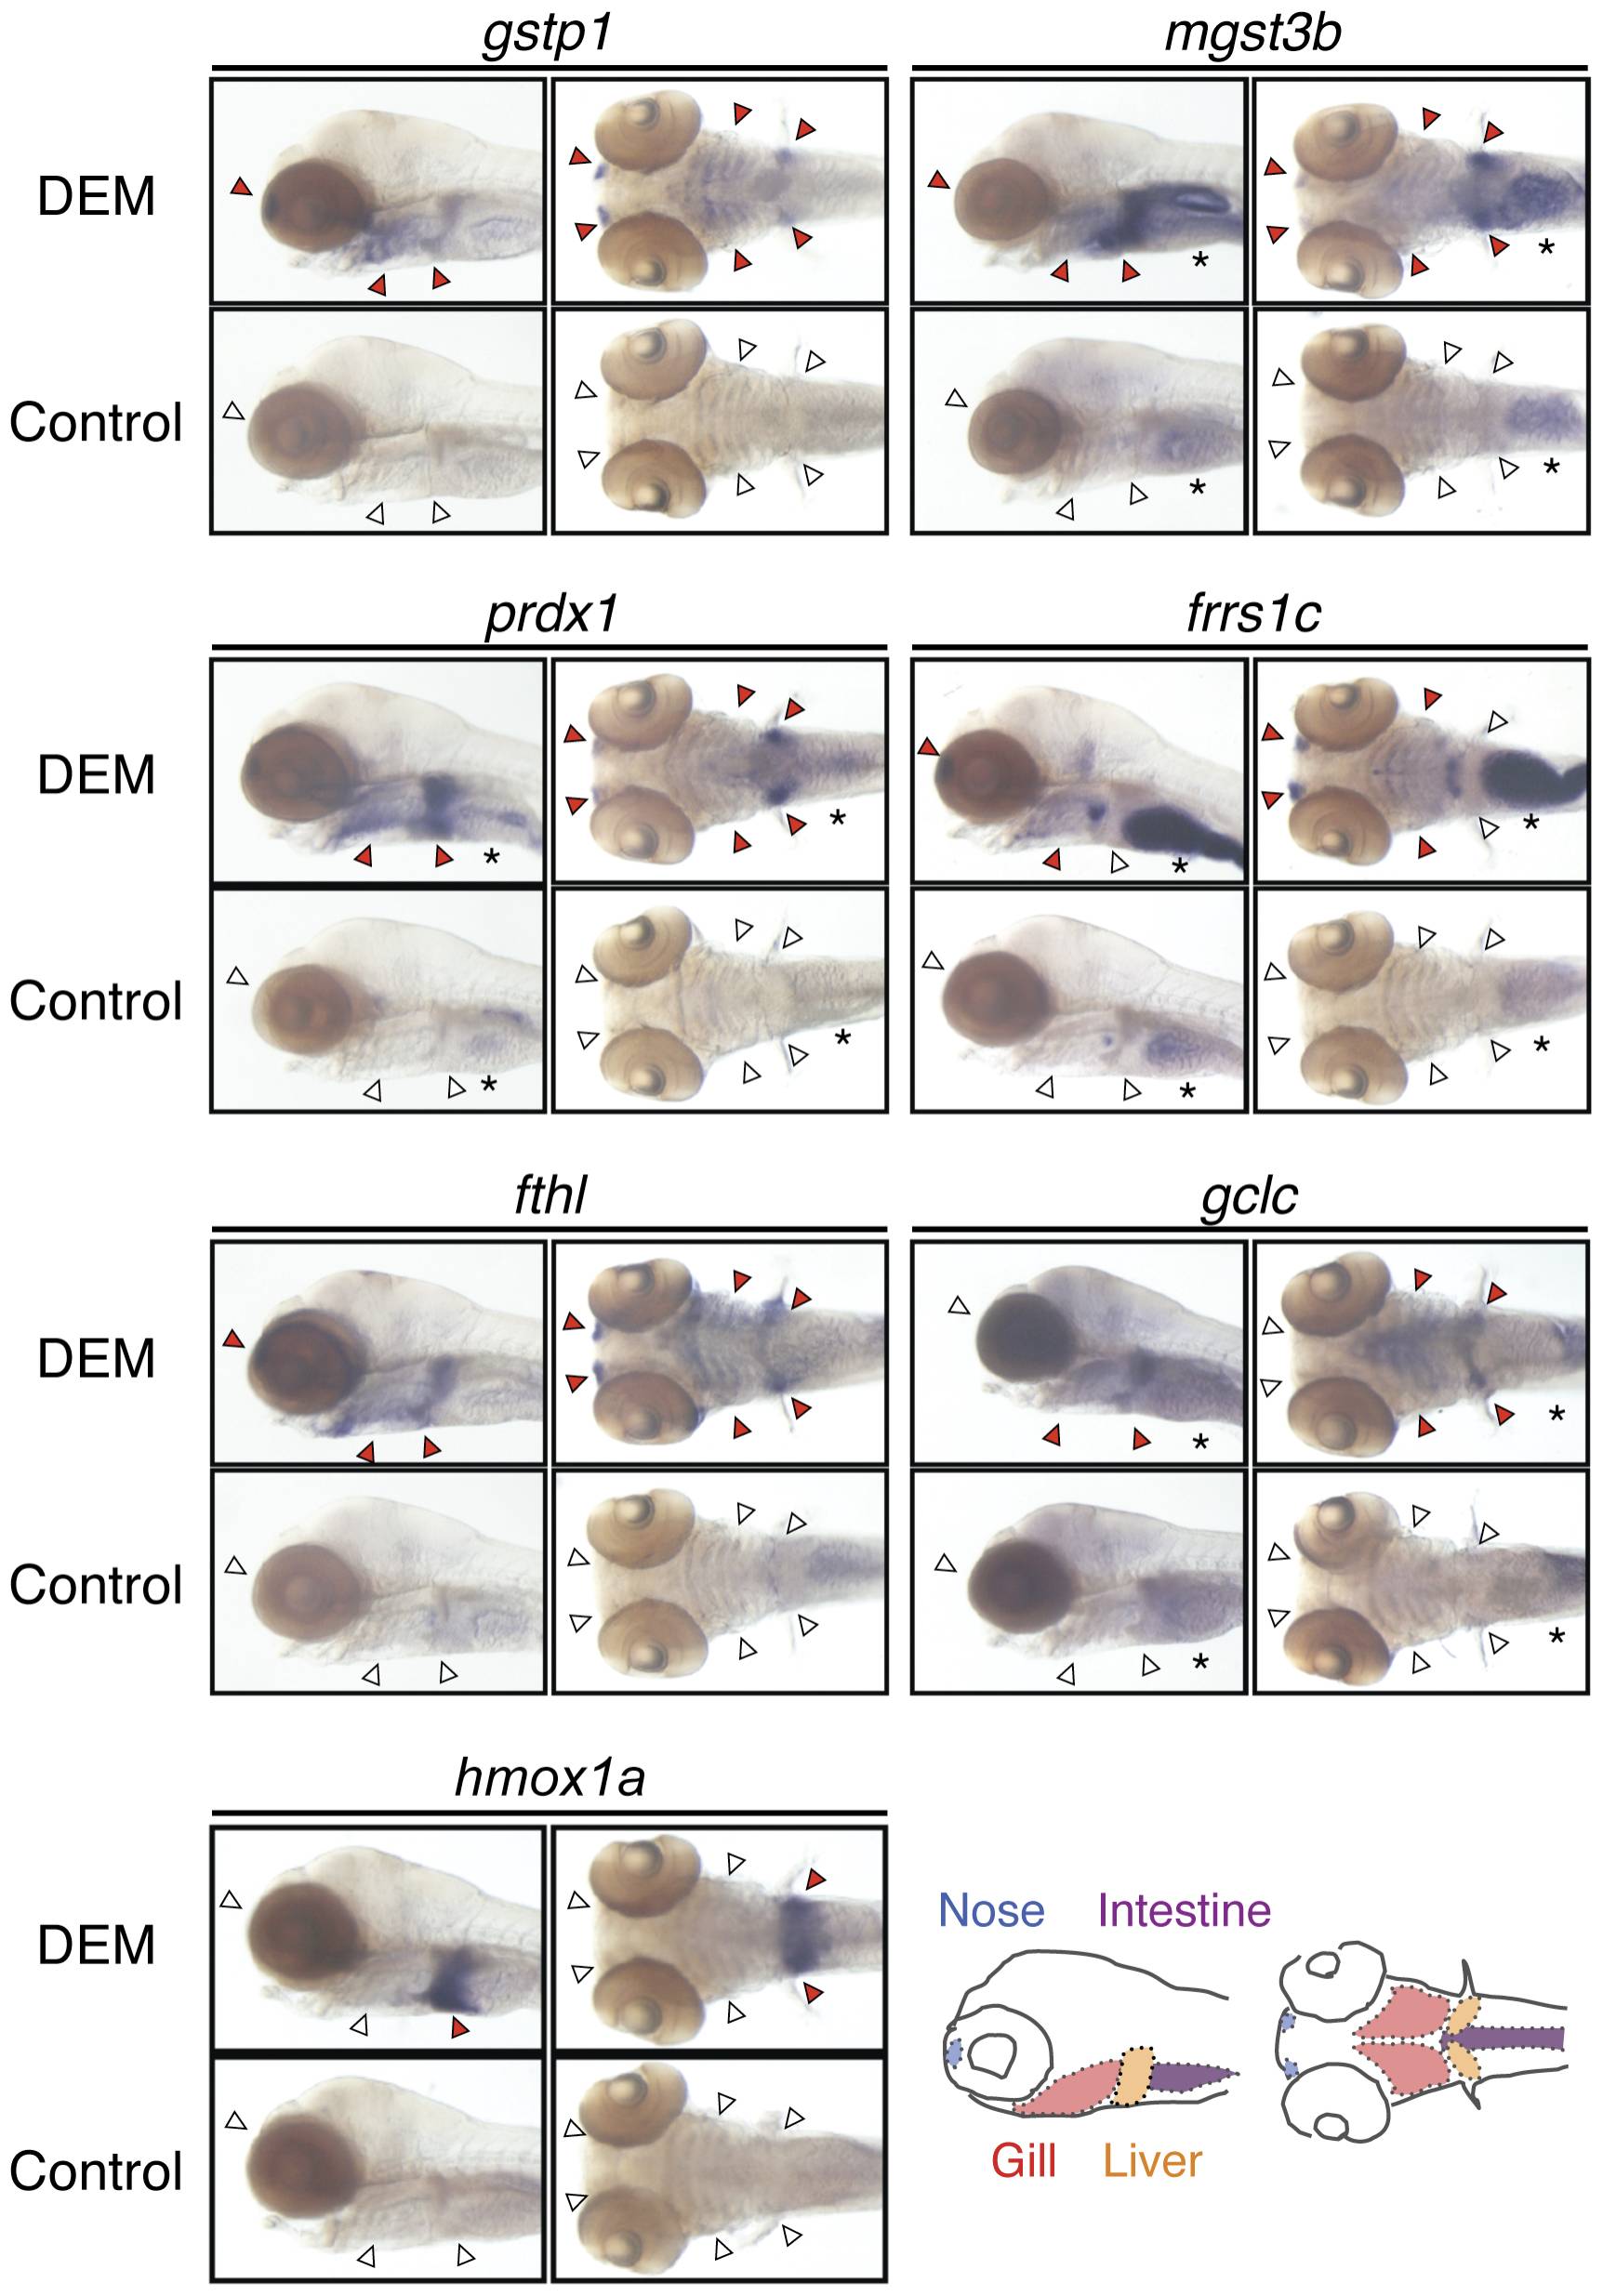
Fig. 3 Tissue-restricted induction of Nrf2 target genes.
5-dpf larvae were treated with or without 100 µM DEM for six hours (three hours only for hmox1a) and expression of indicated genes was analyzed by WISH. Lateral and ventral views. Red and white arrowheads indicate positive and negative expression, respectively, of each gene in the nose, gill and liver. Asterisks denote basal expression in the intestine.
Figure Data
Acknowledgments
This image is the copyrighted work of the attributed author or publisher, and
ZFIN has permission only to display this image to its users.
Additional permissions should be obtained from the applicable author or publisher of the image.
Full text @ PLoS One