
- Title
-
Her9 represses neurogenic fate downstream of Tbx1 and retinoic acid signaling in the inner ear
- Authors
- Radosevic, M., Robert-Moreno, A., Coolen, M., Bally-Cuif, L., and Alsina, B.
- Source
- Full text @ Development
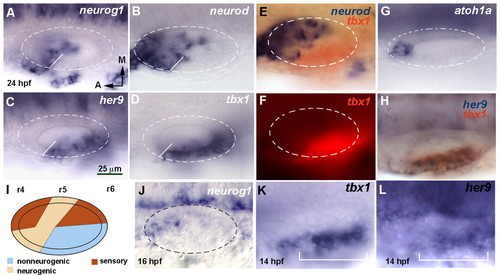
her9 and tbx1 expression is complementary to the neurogenic domain. (A-H,J-L) Dorsal views of flat-mounted zebrafish embryos at 24 hpf, with anterior to the left and medial to the top. Dashed circles delineate the otic vesicle. In situ hybridization was for neurog1 (A), neurod (B), her9 (C), tbx1 (D) and atoh1a (G). White lines in A-D indicate the boundary between the neurogenic and non-neurogenic domains. Double in situ hybridization is shown for tbx1 (red chromogen in E and H, red fluorescence in F) and neurod (blue, E) or her9 (blue, H). (J) neurog1 expression at 16 hpf. (K,L) Expression of tbx1 and her9 in the otic placode at 14 hpf. The bracket indicates the extent of the placodal domain. (I) Schematic representation of the neurogenic, sensory and non-neurogenic territories. r, rhombomere. All images are at the same magnification. EXPRESSION / LABELING:
|
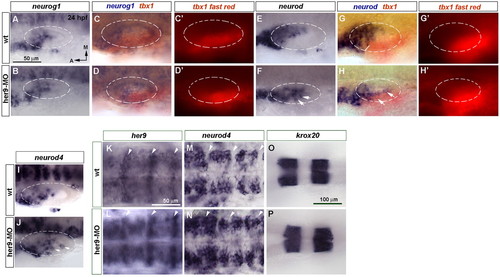
Blocking her9 function results in ectopic expression of the proneural genes neurod and neurod4. (A-J) In situ hybridization of 24 hpf wild-type (wt) and Her9 morphant zebrafish embryos to detect changes in neurog1 (A-D′), neurod (E-H′) and neurod4 (I,J) expression in the inner ear. (C-D′,G-H′) Double in situ hybridization for tbx1 (red chromogen in C,D,G,H and red fluorescence in C′,D′,G′,H′) and neurog1 (blue) or neurod (blue). Dashed circles delineate the otic vesicle. Arrows indicate ectopic neurogenesis. (K,L) Expression of high levels of her9 at the hindbrain rhombomeric boundaries (arrowheads). (M,N) neurod4 expression is expanded in the hindbrain. (O,P) krox20 expression in rhombomeres 3 and 5 is unchanged in Her9 morphants. A-J, K-N and O,P are at the same magnification. EXPRESSION / LABELING:
|
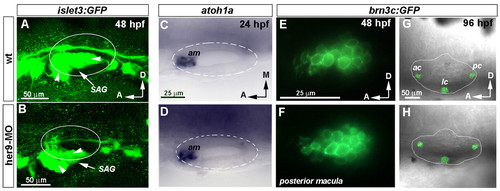
Depletion of her9 distorts the development of the SAG but not the generation of hair cells. (A,B) Three-dimensional reconstruction of the SAG at 48 hpf visualized in wild-type and her9-MO-injected zebrafish embryos carrying the islet3:GFP transgene. Arrowheads point to SAG branches. (C,D) Expression of atoh1a in wild-type and Her9 morphant embryos at 24 hpf. (E,F) Sagittal sections of posterior macula showing GFP fluorescence under the control of brn3c (pou4f3) reporter in a wild-type and her9-MO-injected embryo. (G,H) Three-dimensional reconstruction of selected confocal sections showing the otic cristae in wild-type and her9-MO-injected embryos. GFP in adjacent neuromasts of the lateral line has been removed for clarity. C,D, E,F and G,H are at the same magnification. SAG, statoacoustic ganglion; am, anterior macula; ac, anterior crista; lc, lateral crista; pc, posterior crista. |
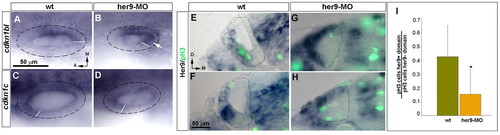
her9 inhibits Cdkns and controls cell proliferation. (A-D) In situ hybridization of cdkn1bl (A,B) and cdkn1c (C,D) in wild-type (A,C) and her9-MO-injected (B,D) zebrafish embryos at 24 hpf. Arrow indicates posterolateral expansion of cdkn1bl expression. (E-H) Transverse sections of wild-type and Her9 morphant embryos stained by in situ hybridization for her9 (blue) and immunohistochemistry with anti-pH3 (green). (I) Proportion of pH3-positive cells counted inside and outside the her9-expression domain in wild-type and Her9-depleted embryos. Error bars indicate mean + s.e.m. *P=0.001. A-D and E-H are at the same magnification. EXPRESSION / LABELING:
|

tbx1 is genetically upstream of her9. (A-C) Expression of her9 in 18 hpf zebrafish embryos from heterozygotic vgotm208 crosses. (D-I) Double in situ hybridization for tbx1 (red) and neurog1 (blue, D-F) or neurod (blue, G-I) in 24 hpf embryos from heterozygotic vgotm208 crosses. Arrows point to ectopic proneural expression. Two examples of vgotm208 mutants are given for each gene in A-I. (J) Proportion of descendants from heterozygotic crosses showing a strong phenotype (complete abrogation of her9 expression, substantial expansion of neurog1 and neurod), mild phenotype or wild-type phenotype at 24 hpf. (K,L) Double in situ hybridization for tbx1 (red) and her9 (blue) shows ectopic expression of her9 (arrow) after injection of capped tbx1 mRNA. (M,N) Double in situ hybridization for tbx1 (red) and neurod (blue) at 24 hpf shows downregulation of neurod after overexpression of capped tbx1 mRNA. All images are at the same magnification. EXPRESSION / LABELING:
|
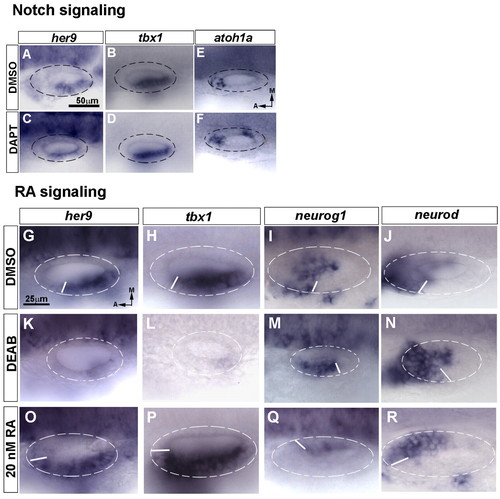
Retinoic acid, but not Notch, regulates her9 and tbx1 expression in the inner ear. (A-F) Expression of her9 (A,C), tbx1 (B,D) and atoh1a (E,F) at 24 hpf in control (DMSO) and Notch-inhibited (DAPT-treated) zebrafish embryos. (G-R) Expression of her9 (G,K,O), tbx1 (H,L,P), neurog1 (I,M,Q) and neurod (J,N,R) at 24 hpf in embryos treated with DMSO (G-J), the retinaldehyde dehydrogenase inhibitor DEAB (K-N) or retinoic acid (RA) (O-R) from 10.5 hpf. The shift of the boundary of the neurogenic and non-neurogenic compartments is depicted by the white line in each otic vesicle. A-F and G-R are at the same magnification. EXPRESSION / LABELING:
|
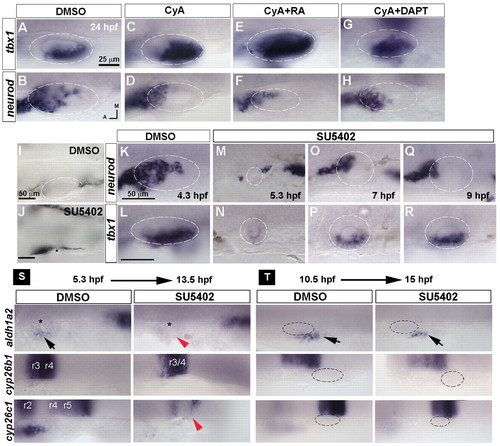
Temporal requirement for Hh and Fgf signals in otic development. (A-H) Expression of tbx1 and neurod in 24 hpf zebrafish embryos treated with DMSO, the Hh inhibitor cyclopamine A (CyA), CyA+RA and CyA+DAPT starting from 10.5 hpf. (I,J) Bright-field images of 30 hpf embryos treated with DMSO or the Fgf inhibitor SU5402 starting from 4.3 hpf reveals a requirement for Fgf signaling at this stage for otic placode induction. Asterisk indicates putative position of otic vesicle. (K-R) Stage-dependent influence of Fgf signaling on neurod and tbx1 expression. (S,T) In situ hybridization for aldh1a2, cyp26b1 and cyp26c1 in embryos treated with DMSO or SU5402 starting from 5.3 hpf or 10.5 hpf. Black arrows indicate mesodermal expression of aldh1a2; red arrowheads indicate suppression of aldh1a2 and cyp26c1 expression; asterisk indicates position of the otic placode. A-H, I,J and K-R are at the same magnification. EXPRESSION / LABELING:
|
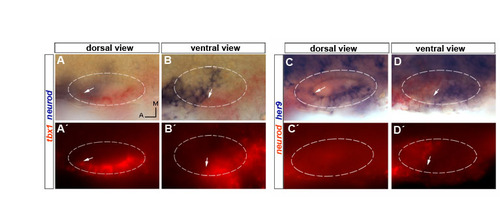
Complementary expression of neurod and tbx1/her9 in 24 hpf wild-type embryos. (A-B′) Double in situ hybridization for neurod (blue) and tbx1 (red) at two different focal planes. Arrows point to the anterior limit of tbx1 expression. (C-D′) Double in situ hybridization for neurod (red) and her9 (blue) at two different focal planes. Arrows point to the anterior limit of her9 expression (C,D) and to posterior limit of neurod expression (D′). EXPRESSION / LABELING:
|
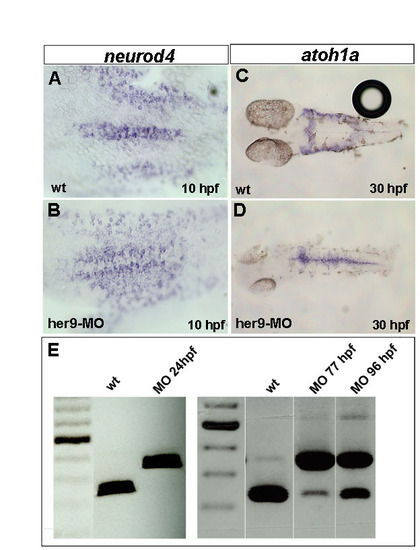
Depletion of Her9 by injection of a splice donor morpholino (her9-MO) at the 1-cell stage expands neurogenic stripes and affects her9 mRNA splicing until 77 hpf. (A-D) Expression of neurod4 and atoh1a in wild-type and her9-MO-injected embryos at 10 and 30 hpf. Anterior is to the left. (E) Temporal analysis of her9 mRNA splicing by RT-PCR in wild type and embryos injected with her9-MO. |
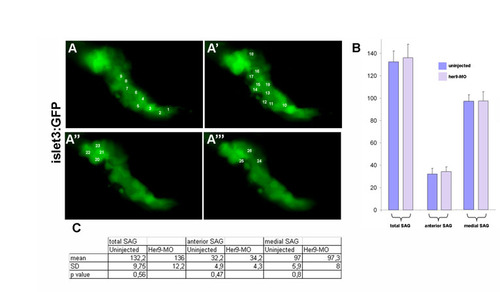
Counting of SAG neurons in wild-type and her9-MO-injected embryos. (A-A′′′) Individual SAG neurons were counted on z-stack series (step <1 μm) of coronal sections of 48 hpf wild-type or her9-MO-injected embryos. Anterior is to the left, medial is down. (B,C) Bar diagram (B) and table (C) showing the mean number of neurons in whole SAG, and separately in its anterior and medial parts. Error bars indicate mean+s.e.m. |
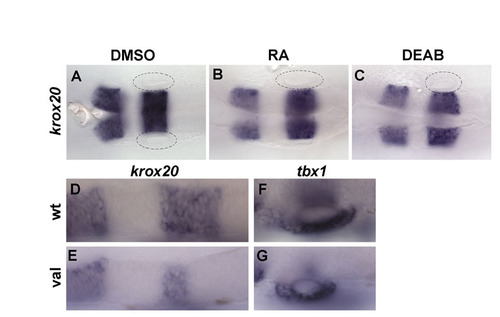
Posterolateral specification of the inner ear is not dependent on AP hindbrain patterning. (A-C) krox20 expression in embryos treated from 10.5 until 24 hpf with DMSO (A), 20 nM RA (B) or 20 μM DEAB (C), showing no hindbrain patterning defects. (D-G) Expression of krox20 (D,E) and tbx1 (F,G) in wild-type and valb337 mutant embryos. Note the strong reduction of krox20 expression in rhombomere 5 (E). Anterior is to the left. |
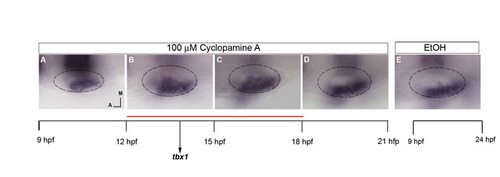
Hh has a role in limiting tbx1 expression posteromedially, acting between 12 and 18 hpf. (A-E) Embryos at 24 hpf probed by in situ hybridization for tbx1 and krox20 after treatment with 100 μM CyA from 9-12 hpf (A), 12-15 hpf (B), 15-18 hpf (C), 18-21 hpf (D) or with ethanol as a control (E). |