
- Title
-
Mtx2 directs zebrafish morphogenetic movements during epiboly by regulating microfilament formation
- Authors
- Wilkins, S.J., Yoong, S., Verkade, H., Mizoguchi, T., Plowman, S.J., Hancock, J.F., Kikuchi, Y., Heath, J.K., and Perkins, A.C.
- Source
- Full text @ Dev. Biol.
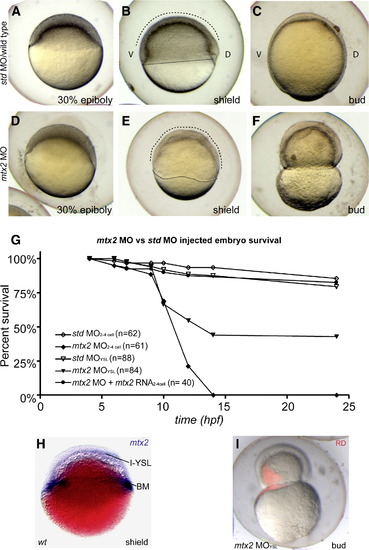
Mtx2 is essential for epiboly. (A-F) Lateral views through epiboly, ″D″ and ″V″ mark dorsal and ventral sides of embryos, respectively. Std MO controls (A–C) proceeded through epiboly normally. However, mtx2 MO injected embryos displayed an epiboly defect phenotype (D-F). Specifically, mtx2 MO injected embryos appeared similar to controls until 30% epiboly. When controls reached shield stage (B), mtx2 MO injected embryos had an irregular blastoderm cap and blastoderm margin (dashed and dotted lines, respectively, in panels B and D) and had not clearly specified a shield. Lysis of mtx2 MO injected embryos occurred, due to blastoderm constriction (F), close to the timing of bud stage in std MO embryos (C). (G) Survival rates for embryos injected with std or mtx2 MO either early (two- to four-cell stage), late (YSL) or with 100 pg mtx2 capped RNA (two- to four-cell stage). (H) Shield stage whole-mount in situ for mtx2 in a wiFi> MO either early (two- to four-cell stage), late (YSL) or with 100 pg mtx2 capped RNA (two- to four-cell sld-type embryo, Nomarski optical section. The I-YSL and blastoderm margin (BM) staining pattern is indicated. (I) A merged bright/dark-field image of a bud stage embryo injected at 1000 stage with mtx2 MO and rhodamine dextran (RD). EXPRESSION / LABELING:
PHENOTYPE:
|
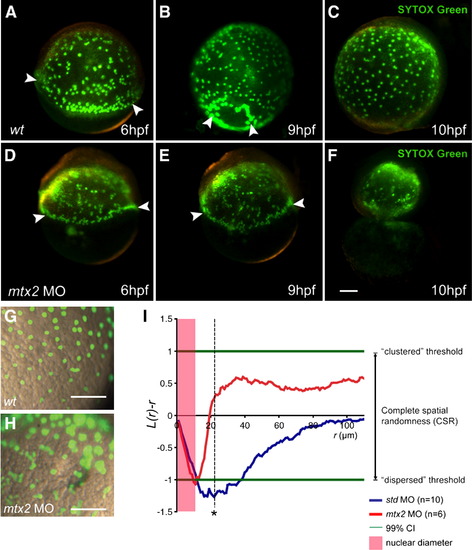
YSL nuclei are present but disordered in mtx2 morphants. (A–H) Fluorescence microscope images of SYTOX Green injected embryos. Wild-type (A–C) and mtx2 MO (D–F) injected embryos (two- to four-cell stage), injected at 1000-cell stage with SYTOX Green. (A, D) Arrowheads indicate YSN at the blastoderm margin. mtx2 MO injected embryos have a similar collection of YSN at the blastoderm margin (arrowheads in panel D) but show an abnormal distribution of YSN in the inner YSL (I-YSL), which persists (E) until just before yolk cell lysis (F) when the YSN disintegrate. High magnification, merged bright field/fluorescence imaging (G, H) shows the majority of I-YSL nuclei are evenly spaced in wild-type embryos (G) but randomly distributed in mtx2 MO injected embryos (H). Scale bar = 100 μm in panel F (applies to panels A–F), panels G and H. (I) YSN spatial distribution analysis. At distances beyond the diameter of each YSL nucleus (shaded red zone), wild-type YSN are dispersed with maximal deflection from complete spatial randomness (CSR) at r = 22 μm (asterisk indicates significance p value < 0.001). However, in mtx2 morphants, the nuclei are randomly distributed. K-functions are means for wild-type (n = 10) and mtx2 MO (n = 6) embryos, standardized on the 99% confidence interval (CI). |
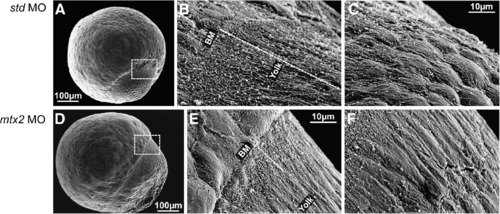
Scanning electron microscopy of the E-YSL. (A-F) Scanning electron microscopy of std MO and mtx2 MO injected embryos at 70-80% epiboly. The region between the blastoderm and the yolk (dashed box in panels A and D) is the site of the external yolk syncytial layer (E-YSL). 2000x magnification (B, C, E and F) reveals that std MO embryos (B, C) have extensive membrane folding in a region ~50-60 µm long (dashed line in panel B) that obscures the blastoderm margin/E-YSL border (″BM″ in panel B) and also the E-YSL/yolk border ("Yolk" in panel B). The membrane folding is most extensive closest to the blastoderm margin and decreases vegetally (C). In contrast, mtx2 MO embryos (E, F) have greatly reduced membrane folding, such that the margins of the E-YSL (″BM″ and ″yolk″ in panel E) can both be seen. Yolk membrane folding is also reduced (F). PHENOTYPE:
|
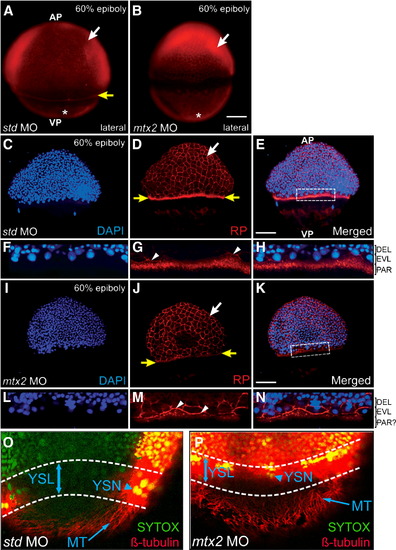
Cytoskeletal elements of the zebrafish yolk during epiboly. (A, B) Rhodamine–phalloidin (RP) stained embryos at 60% epiboly, pre-injected with std MO (A) or mtx2 MO (B). RP stains the (vegetal) actin mat (asterisks), the F-actin ring of the E-YSL (yellow arrow in panel A only) and peripheral F-actin within EVL cells (white arrows). (C–N) Confocal analysis of RP (D, G, J, M) and DAPI (C, F, I, L) stained 60% epiboly stage embryos. (G–L) std MO embryos have a punctate F-actin ring, vegetal to the blastoderm margin (yellow arrows in panel D). Detail of the dotted box in panel E is shown in panels F–H. (I–N) mtx2 MO injected embryos also stain the periphery of EVL cells (white arrows in panels D, J), the leading edge of the EVL (white arrowheads in panels G, M), but not the punctate F-actin ring (yellow arrows in panel J). In std MO controls the larger DAPI stained nuclei (in panels F, H) are EVL nuclei that have migrated past the, smaller, deep layer nuclei. These nuclei are less obvious in mtx2 MO embryos (L, N). nel J). In std MO controls the larger DAPI stained nuclei (in panels F, H) are EVL nuclei that have migrated past the, sma(O, P) Confocal image projection of microtubule organization at 70% epiboly (β-tubulin immunofluorescence). A microtubule network is present in both std and mtx2 MO injected embryos (arrow in panels O and P). All nuclei (including YSN) were counterstained with SYTOX Green (arrowhead in panels O and P). Overlapping tubulin/SYTOX staining patterns result in ″yellow″ fluorescence. PHENOTYPE:
|
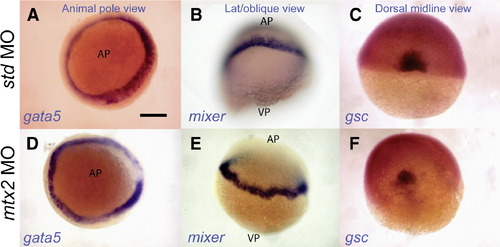
Normal endoderm and shield specification in mtx2 morphants. Whole-mount in situ hybridization for faust/gata5 (A, D) and mixer (B, E) shows endoderm specification in mtx2 MO injected embryos (D, E). The blastoderm margin appears a little irregular in mtx2 MO injected embryos (D–F). Goosecoid (gsc) is expressed in the shield of mtx2 MO injected embryos (F) but is reduced when compared with std MO injected embryos (C). All embryos are at shield stage. Panels A and D are animal pole views; panels B and E are lateral or oblique views; panels C and F are dorsal midline views. AP = animal pole, VP = vegetal pole. Scale bar = 200 μm in panel A (applies to panels A–F). |
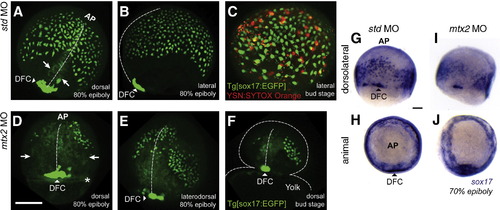
Morphogenetic movements of mesendoderm are disrupted in mtx2 MO injected embryos. Live confocal imaging of std MO (A–C) and mtx2 MO (D–F) injected transgenic [sox17:EGFP+] embryos. std MO injected embryos at 80% epiboly (A, B) show the same expression pattern seen in sox17 in situs (G–J), with dorsal forerunner cells (DFC) showing the highest GFP+ expression (arrowheads in panels A and B). Axial mesoderm is not thought to express Sox17, but these cells are faintly visible (arrows) converging on the midline (dashed line) in panel A. (C) SYTOX-orange injection into the YSL of Tg[sox17:EGFP+] embryos shows Sox17:EGFP+ cells outnumber YSN by approximately 4:1. In mtx2 MO injected Tg[sox17:EGFP+] embryos, GFP+ cells are detected (D, E), but are disorganized and fail to descend vegetally. An unknown, circumferential ring-like structure was also visible in mtx2 MO injected embryos at this time point (asterC GFP+ cells are detected (D, E), but are disorganized and fail to descend vegetally. An unknown, circumferential riisk in panel D). Axial mesoderm cells in mtx2 MO injected embryos are broadly spread out (arrows in panel D) from the midline (vertical dashed line in panels D–F) even at the last stage before yolk lysis (F). (G–J) The sox17 expression pattern in std MO (G, H) and mtx2 MO (I, J) injected embryos at 60–70% epiboly parallel the GFP fluorescence pattern seen in the Tg[sox17:EGFP] line. Scale bar = 200 μm in panel D (applies to panels A–F), 100 μm in panel G (applies to panels G–J). PHENOTYPE:
|
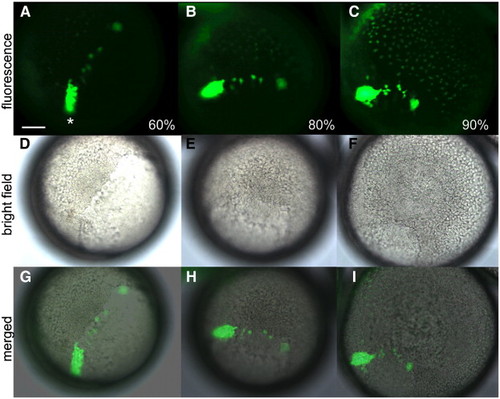
Tg[sox17:EGFP] fluorescence microscopy images. Fluorescent (A–C), bright field (D–F) and merged images (G–I) from the sox17:EGFP transgenic line, showing that the dorsal forerunner cells are visible (asterisk) from 60% to 90% epiboly by fluorescent microscopy. GFP+ endoderm cells are also faintly visible by 90% epiboly. EXPRESSION / LABELING:
|
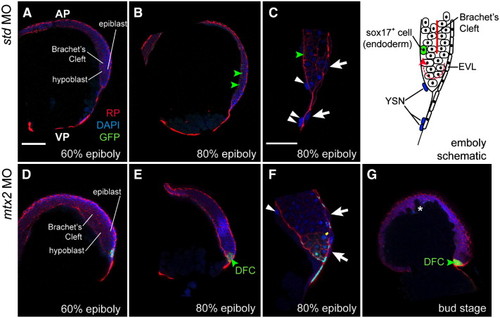
Involution of the blastoderm is not Mtx2-dependent. Vibratome sections of Tg[sox17:EGFP] embryos (A–C) show that Brachet's cleft can be seen from 60% epiboly onwards by rhodamine–phalloidin staining. Involution, shown in the schematic (top right), still occurs in mtx2 MO injected Tg[sox17:EGFP] embryos (D–G), however, the blastoderm is thicker, presumably because the blastoderm does not migrate as far vegetally. Green arrowheads indicate GFP+ cells, white arrowheads indicate YSN, white arrows indicate EVL cells, white asterisk highlights the irregular shape of the blastoderm at the animal pole. DFC = dorsal forerunner cells (not visible in standard controls). Scale bar in A = 150 μm (for A, B, D, E, G). Scale bar in C = 100 μm (for C, F). EXPRESSION / LABELING:
PHENOTYPE:
|
Reprinted from Developmental Biology, 314(1), Wilkins, S.J., Yoong, S., Verkade, H., Mizoguchi, T., Plowman, S.J., Hancock, J.F., Kikuchi, Y., Heath, J.K., and Perkins, A.C., Mtx2 directs zebrafish morphogenetic movements during epiboly by regulating microfilament formation, 12-22, Copyright (2008) with permission from Elsevier. Full text @ Dev. Biol.