
Image
|
Figure Caption
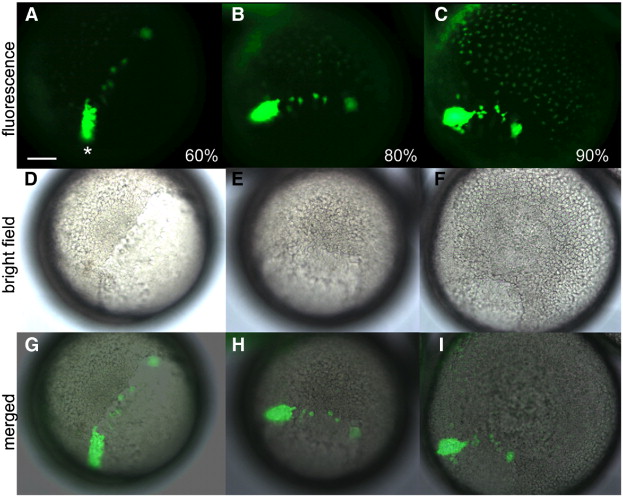
Fig. S2 Tg[sox17:EGFP] fluorescence microscopy images. Fluorescent (A–C), bright field (D–F) and merged images (G–I) from the sox17:EGFP transgenic line, showing that the dorsal forerunner cells are visible (asterisk) from 60% to 90% epiboly by fluorescent microscopy. GFP+ endoderm cells are also faintly visible by 90% epiboly.
Figure Data
Acknowledgments
This image is the copyrighted work of the attributed author or publisher, and
ZFIN has permission only to display this image to its users.
Additional permissions should be obtained from the applicable author or publisher of the image.
Reprinted from Developmental Biology, 314(1), Wilkins, S.J., Yoong, S., Verkade, H., Mizoguchi, T., Plowman, S.J., Hancock, J.F., Kikuchi, Y., Heath, J.K., and Perkins, A.C., Mtx2 directs zebrafish morphogenetic movements during epiboly by regulating microfilament formation, 12-22, Copyright (2008) with permission from Elsevier. Full text @ Dev. Biol.