
- Title
-
Conserved and acquired features of adult neurogenesis in the zebrafish telencephalon
- Authors
- Adolf, B., Chapouton, P., Lam, C.S., Topp, S., Tannhauser, B., Strähle, U., Gotz, M., and Bally-Cuif, L.
- Source
- Full text @ Dev. Biol.
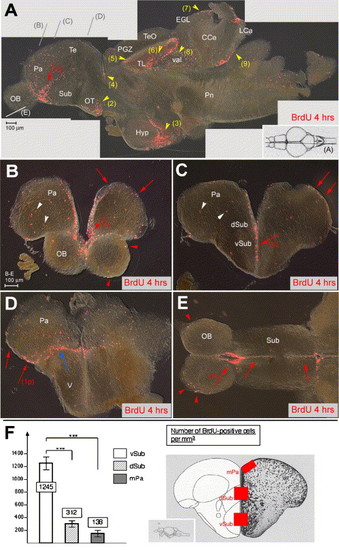
Proliferation sites in the zebrafish adult telencephalon. (A–E) BrdU immunocytochemistry (red staining) on brain sections of 6-month-old adult zebrafish sacrificed 4 h after 2 BrdU injections. Vibratome sections are observed under conventional fluorescence microscopy, (A) parasagittal section, anterior left, (B–D) cross-sections at increasingly posterior levels (indicated in panel A), dorsal up, (E) horizontal section (level indicated in panel A), anterior left. In panel A, intensely labeled sites are numbered (red arrows: telencephalon, yellow arrowheads: other domains). Note the stripe of intense staining within the ventral subpallium (numbered 1 in all sections). Other sites: (2) optic tracts, (3) ventricular zone of the hypothalamus, (4) anterior thalamus, (5) periventricular gray zone, (6) torus longitudinalis, (7) cerebellar external granular layer, (8) valvula cerebelli, (9) lobus caudalis cerebelli. Nonventricular proliferation is also visible in all cross-sections and indicated by white arrowheads. The only staining visible in the OB (E, red arrowheads) likely corresponds to glia in the superficial olfactory nerve layer (Byrd and Brunjes, 2001). In the posterior telencephalon, prominent proliferation is observed at the junction between the dorsal and ventral domains (blue arrow in panel D) and in the posterior pallium (red arrow numbered 1p in panel D). (F) Number of BrdU-positive cells in the telencephalon along the DV axis, counted in the areas boxed in red in the scheme on the right panel (Wullimann et al., 1996). Ventral subpallium: 1245 ± 245 BrdU-positive cells/mm3, dorsal subpallium: 312 ± 136/mm3, medial pallium: 138 ± 37/mm3 (on a total of 9 sections from 3 different fish at anterior telencephalic levels, all areas containing a comparable total number of cells, statistical analysis performed using independent samples Student′s t test). Abbreviations, after Wullimann et al. (1996): CCe: corpus cerebellaris, EGL: external granular layer, Hyp: hypothalamus, IGL: internal granular layer, LCa: lobus caudalis cerebelli, Pa: pallium, PGZ: periventricular gray zone, OB: olfactory bulb, OT: optic tract, Pn: pons, Sub: subpallium, Te: telencephalon, TeO: tectum opticum, TL: torus longitudinalis, V: posterior domain of the ventral telencephalon, val: valvula cerebelli. |
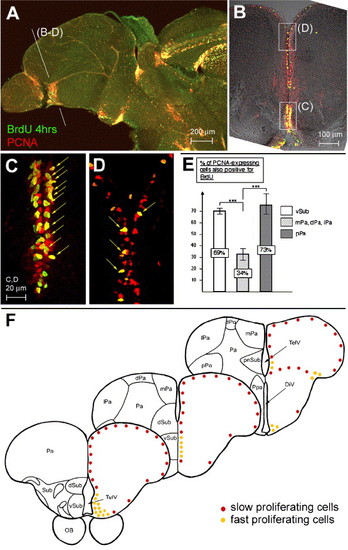
Different cell cycle characteristics between proliferation zones in the adult zebrafish telencephalon. (A–D) Double immunolabeling for PCNA (red) and BrdU (green) on sagital (A, anterior left) and cross (panels B–D, dorsal up) vibratome sections observed under confocal microscopy; panels C, D are the areas boxed in panel B observed at higher magnification and on an optic section of 1.5 μm. PCNA expression and BrdU-positive cells are concentrated ventrally (compare the density of PCNA-only (red) and double-labeled (yellow arrows) cells in B–D). (E) Labeling index (number of PCNA-positive cells that are also BrdU-positive) in the telencephalon along the DV axis. In the anterior telencephalon: 69% in the ventral subpallium, n = 115 PCNA-positive cells counted, against 33.7% in the dorsal subpallium, medial, dorsal, and lateral pallium, n = 327; at the surface of the posterior pallium: 73%, n = 26. (F) Schematic representation of the zones of fast (yellow dots) and slow (red dots) proliferation in the zebrafish adult telencephalon, as identified in panels A–E. Cross-sections are oriented along the AP axis. Abbreviations: see Fig. 1, and DiV: diencephalic ventricle, dPa: dorsal pallium, dSub: dorsal subpallium, lPa: lateral pallium, mPa: medial pallium, pnSub: postcommisural nucleus of the ventral subpallium, Ppa: preoptic nucleus, pPa: posterior pallium, TelV: telencephalic ventricle, vSub: ventral subpallium. |
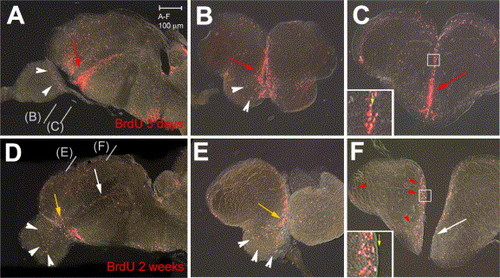
BrdU-labeled cells (red staining) in the zebrafish adult telencephalon 3 days (A–C) or 2 weeks (D–F) after BrdU injection. All views are vibratome sections observed under conventional fluorescence microscopy (A,D: parasagittal sections, anterior left; B, C, E, F: cross-sections at the levels indicated in panels A, D, dorsal up). Note major changes after 2 weeks: (i) the ventral subpallial stripe is diminished caudally (white arrows in panels D, F) and mostly maintained anteriorly (yellow arrows in panels D, E), (ii) labeled cells are observed in the OB (white arrowheads in panels D, E), and (iii) labeled cells have left the ventricle in the pallium and dorsal subpallium (red arrowheads in panel F, compare insets in panels panels C, F, yellow arrow to the ventricle). |
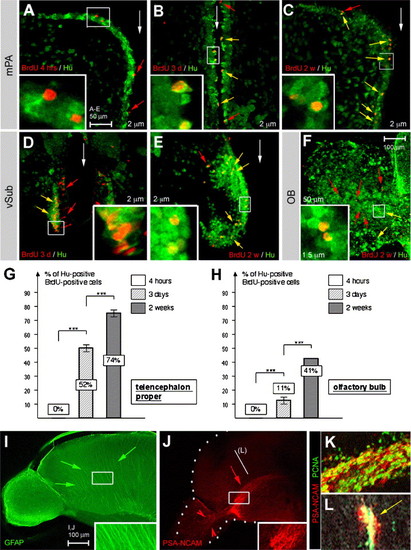
Adult neurogenesis and neuroblast migration in the zebrafish telencephalon. (A–F) Double immunodetection of Hu proteins (green) and BrdU (red) after increasing tracing times (4 h, 3 days—3d, 2 weeks—2w, as indicated). Panels A–E are cross-sections, dorsal up, and panel F is a sagittal section, anterior left, all observed under confocal microscopy with focus on the medial pallium (mPa) (A–C), ventral subpallium (vSub) (D, E) or OB (F). The position of the midline is indicated by white arrows. Examples of cells positive for BrdU but negative for Hu are indicated by red arrowheads, and examples of double positive cells by yellow arrowheads. All insets are high magnifications of the boxed areas. BrdU/Hu double positive cells can be found along the entire DV extent of the telencephalic ventricle, and to a lesser extent in the OB, after 3 days of tracing. G,H: Percentage of BrdU-positive cells also expressing Hu in the anterior telencephalon in the vicinity of the ventricular zone (G) and in the OB (H). Percentage of double-labeled cells for n BrdU-positive cells counted in the telencephalon proper: 0%, n > 500 at 4 h, 52%, n = 942 at 3 days, 74%, n = 406 at 2 weeks. Percentage in the OB: 0%, n > 200 at 4 h, 11.2%, n = 269 at 3 days, 41.5%, n = 458 at 2 weeks. Statistical analysis performed using independent samples Student′s t test. I: Immunodetection of glia using an anti-GFAP antibody (green staining) (sagittal view, anterior left). Unlike in the rodent telencephalon, no longitudinally oriented fibers are visible. Rather, the projections of the detected glial cells (green arrows, see also inset) are arranged radially. (J–L) Immunodetection of PSA-NCAM (red staining) and PCNA (in panels K–L, green staining) (J: sagittal view, anterior left, OB and telencephalon delimited by the white dots; (K) sagittal view, anterior left, high magnification of a double-labeled preparation at the same level as boxed in panel J; (L) cross-section, dorsal up, at the level indicated in panel J). Note the prominent stripe of PSA-NCAM (red arrow in panel J) in the location of proliferating cells in the ventral subpallium (yellow staining in the overlay with PCNA expression in panels K–L). PSA-NCAM-positive cells reach into the olfactory bulb (red arrowheads in panel J). |
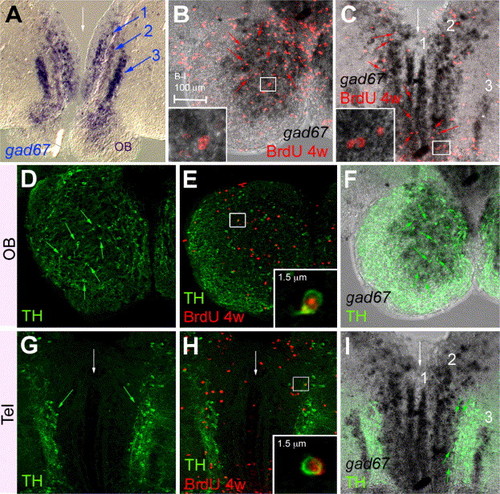
Telencephalic progenitors give rise to gad67- and/or TH-positive neurons in the OB and in the anterior subpallium and medial pallium. Localization of GABA-ergic neurons, revealed by gad67 (A–C, F, I) (ISH, blue or black) expression and compared with the expression of TH (D–I) (immunodetection, green) and/or the localization of BrdU-positive cells after 4 weeks of tracing (B, C, E, H) (red). Panels B and D–F are focussed on the OB, panels C and G–I on the subpallium and medial pallium, white arrows to the midline. All views are cross-sections, anterior up, panels B–I are confocal photomicrographs. In the OB, newborn neurons in the IL largely express gad67 (B, red arrows to examples of double-positive cells, one example is magnified in inset). Most TH-positive neurons in the GL (D) are gad67-positive (F, green arrows to examples of double-positive cells) and a subset of these neurons are newborn (E). In the subpallium and medial pallium, gad67 expression is organized in three bilateral columns (numbered 1–3 in A, C, I), which largely contain newborn neurons (C red arrows to examples of double-positive cells, one example is magnified in inset). Some newborn neurons also express TH (H), but these are mostly not GABAergic (I, green arrow to the restricted subpopulation of gad67/TH double-positive cells). EXPRESSION / LABELING:
|

Pax6a is expressed in neurons of the OB and anterior telencephalon. (A–G) Comparison of pax6a expression (A, B: in situ hybridization, blue; C–G: immunodetection, green or red) with BrdU incorporation (red) after 4 h (B) or 8 weeks (D, F) or with TH (E, G, green). All views are cross-sections, dorsal up, with white arrows to the midline; insets are high magnifications of the boxed areas; panel B is an overlay between bright field and fluorescence. Pax6a is expressed in the OB (A, arrowheads, D,E) and in bilateral telencephalic longitudinal stripes (A, B blue arrows, C green arrows, F, G), but not in proliferating cells (red arrows in panel B, see also C). After 8 weeks of tracing, cells expressing pax6a RNA (not shown) or protein and doubly positive for BrdU can be observed in both the Ob and telencephalon (D, F) (double labeled cells in insets). Coexpression of Pax6a and TH can also be detected in these domains (E, G) (examples of double positive cells are indicated by arrows and some are magnified in insets). (H, I) Schematics summarizing gad67, TH and Pax6a expression in the OB (H) and in the anterior subpallium and pallium (I) as well as the identity of newborn neurons 2 months after BrdU incorporation (color-coded). EXPRESSION / LABELING:
|
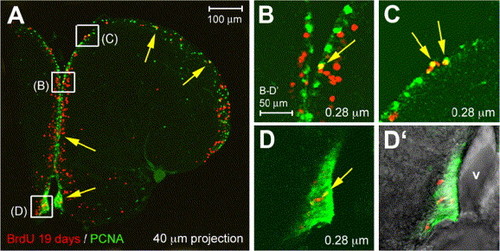
Long-lasting neuronal progenitors in the zebrafish adult telencephalic ventricular zone. Co-immunodetection of PCNA (green) and BrdU (red) after long-term tracing (19 days), observed under confocal microscopy on cross-sections (thickness indicated, dorsal up). Panels B–D are high magnifications of the areas boxed in panel A, panel D′ is a brightfield and fluorescence view of panel D to locate the ventricle (v). While most labeled cells have exited the ventricular zone, a few BrdU-positive cells are retained in cycle (yellow arrows); these cells are located throughout the DV extent of the telencephalic ventricular zone. |
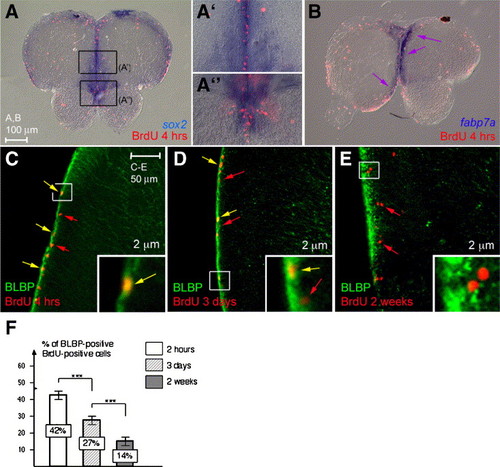
Telencephalic progenitors express sox2 and have molecular characteristics of glia. (A–B) Comparison of BrdU incorporation (red) after 4 h tracing with the expression of sox2 (A–A″) or fabp7a (B) (blue, in situ hybridization). Cross-sections, dorsal up. Telencephalic progenitors are found in the expression domain of both markers. (C–E) Analysis in confocal microscopy (thickness 2 μm) of BLBP protein (green) and BrdU incoporation (red) after 4 h (C), 3 days (D) or 2 weeks (E). Examples of cells positive only for BrdU are indicated by red arrows, examples of cells doubly positive by yellow arrows. (F) Percentage of BLBP-positive cells that are also BrdU-positive after progressively longer tracing times. Note that this number strikingly decreases over time. EXPRESSION / LABELING:
|
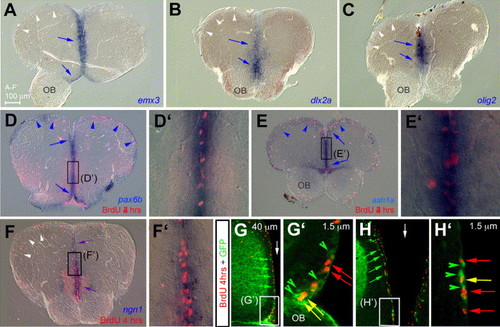
Unique transcription factors code and promoter usage in adult zebrafish telencephalic progenitors. (A–F′) Compared expression of emx3 (A), dlx2a (B), olig2 (C), pax6b (D, D′), ash1a (E, E′), and ngn1 (F, F′), together with BrdU incorporation after 4 h survival (red staining in panels D–F′), on anterior cross-sections (dorsal up). All markers are expressed in progenitors along the telencephalic ventricle at the midline (blue arrows, note the co-labeling with BrdU in panels D–F′). In addition, pax6b and ash1a are expressed in progenitors along the dorsally everted telencephalic ventricle (blue arrowheads in panels D, E), while other markers are not (white arrowheads in panels A–C, F). (G–H′) Determination of the enhancer fragment driving ngn1 expression in adult ventricular telencephalic progenitors by comparing BrdU incorporation (red) and GFP protein (green) in the -3.4ngn1:gfp transgenic line (Blader et al., 2004 and Blader et al., 2003). Cross-sections observed in confocal microscopy, dorsal up, green arrowheads and arrows point to cells expressing GFP only, red arrows to cells positive for BrdU only, and yellow arrows to double-labeled cells. Panels G and G2 focus on the ventral subpallium, panels H and H′ on the medial pallium, white arrows to the midline. Note that GFP distribution in -3.4ngn1:gfp is in agreement with endogenous ngn1 expression (compare with F). OB: olfactory bulb. EXPRESSION / LABELING:
|

Unillustrated author statements EXPRESSION / LABELING:
|
Reprinted from Developmental Biology, 295(1), Adolf, B., Chapouton, P., Lam, C.S., Topp, S., Tannhauser, B., Strähle, U., Gotz, M., and Bally-Cuif, L., Conserved and acquired features of adult neurogenesis in the zebrafish telencephalon, 278-293, Copyright (2006) with permission from Elsevier. Full text @ Dev. Biol.