
|
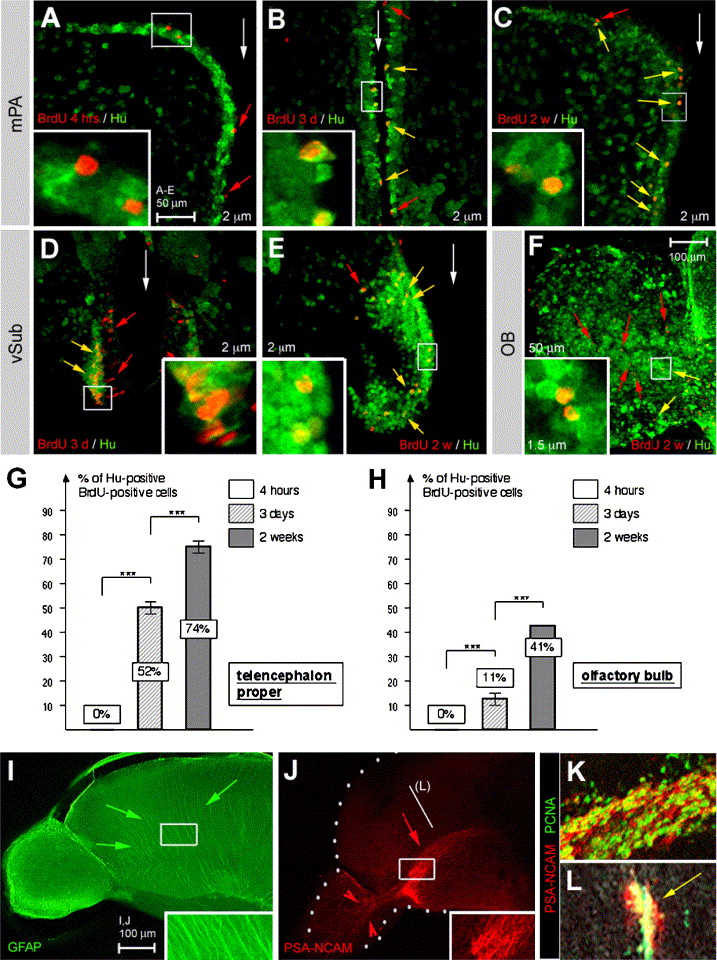
Fig. 4 Adult neurogenesis and neuroblast migration in the zebrafish telencephalon. (A–F) Double immunodetection of Hu proteins (green) and BrdU (red) after increasing tracing times (4 h, 3 days—3d, 2 weeks—2w, as indicated). Panels A–E are cross-sections, dorsal up, and panel F is a sagittal section, anterior left, all observed under confocal microscopy with focus on the medial pallium (mPa) (A–C), ventral subpallium (vSub) (D, E) or OB (F). The position of the midline is indicated by white arrows. Examples of cells positive for BrdU but negative for Hu are indicated by red arrowheads, and examples of double positive cells by yellow arrowheads. All insets are high magnifications of the boxed areas. BrdU/Hu double positive cells can be found along the entire DV extent of the telencephalic ventricle, and to a lesser extent in the OB, after 3 days of tracing. G,H: Percentage of BrdU-positive cells also expressing Hu in the anterior telencephalon in the vicinity of the ventricular zone (G) and in the OB (H). Percentage of double-labeled cells for n BrdU-positive cells counted in the telencephalon proper: 0%, n > 500 at 4 h, 52%, n = 942 at 3 days, 74%, n = 406 at 2 weeks. Percentage in the OB: 0%, n > 200 at 4 h, 11.2%, n = 269 at 3 days, 41.5%, n = 458 at 2 weeks. Statistical analysis performed using independent samples Student′s t test. I: Immunodetection of glia using an anti-GFAP antibody (green staining) (sagittal view, anterior left). Unlike in the rodent telencephalon, no longitudinally oriented fibers are visible. Rather, the projections of the detected glial cells (green arrows, see also inset) are arranged radially. (J–L) Immunodetection of PSA-NCAM (red staining) and PCNA (in panels K–L, green staining) (J: sagittal view, anterior left, OB and telencephalon delimited by the white dots; (K) sagittal view, anterior left, high magnification of a double-labeled preparation at the same level as boxed in panel J; (L) cross-section, dorsal up, at the level indicated in panel J). Note the prominent stripe of PSA-NCAM (red arrow in panel J) in the location of proliferating cells in the ventral subpallium (yellow staining in the overlay with PCNA expression in panels K–L). PSA-NCAM-positive cells reach into the olfactory bulb (red arrowheads in panel J).
Reprinted from Developmental Biology, 295(1), Adolf, B., Chapouton, P., Lam, C.S., Topp, S., Tannhauser, B., Strähle, U., Gotz, M., and Bally-Cuif, L., Conserved and acquired features of adult neurogenesis in the zebrafish telencephalon, 278-293, Copyright (2006) with permission from Elsevier. Full text @ Dev. Biol.