- Title
-
Plasticity in zebrafish hox expression in the hindbrain and cranial neural crest
- Authors
- Schilling, T.F., Prince, V., and Ingham, P.W.
- Source
- Full text @ Dev. Biol.
|
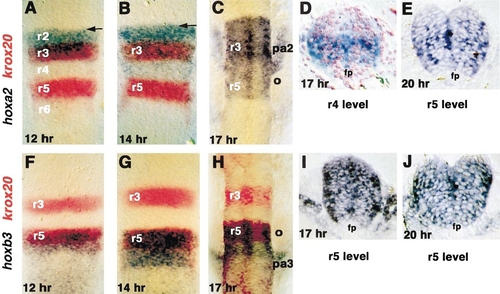
Dynamic changes in hox expression in the embryonic hindbrain and neural crest. Whole-mount in situ hybridizations and transverse sections for (A–E) hoxa2 and (F–J) hoxb3. A, B, and F–H show double in situs with krox20 (red) as a marker of r3 and r5; all whole mounts are shown in dorsal view with anterior to the top. (A) At 12 h (5 somites) hoxa2 is expressed in r2 and r3 with diffuse limits (e.g., as marked by arrow at presumptive r1/r2 boundary). (B) At 14 h (10 somites) the anterior expression limit has sharpened (arrow) and low level expression is apparent in r4 and r5. (C) At 17 h (16 somites) expression is also apparent in the neural crest stream, migrating out to the second pharyngeal arch (pa2). (D) Transverse section through the r4 level at 17 h reveals that hoxa2 expression is limited to the ventral half of the keel; this sample is counterstained with eosin. (E) Transverse section through the r5 level at the 20 h shows reduced hoxa2 expression in the floor plate (fp). (F) At 12 h hoxb3 is expressed in r5 and r6 and more posteriorly; the anterior limit is diffuse at this stage. (G) At 14 h hoxb3 expression in r5 and r6 has upregulated and the anterior limit is beginning to sharpen. (H) At 17 h expression is apparent in the neural crest migrating out into the third pharyngeal arch. (I, J) Transverse sections through the r5 level at 17 and 20 h show reduced expression levels in the floor plate. |
|
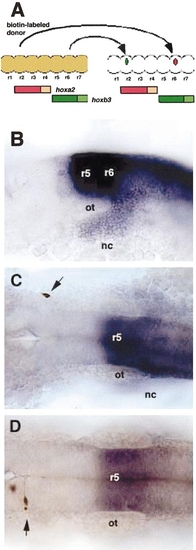
Single-cell transplantation to test plasticity in hox expression. (A) Diagram of a dorsal view of the neural tube illustrating the transplantation technique. Rhombomere levels (r1–7) are indicated as bulges, though transplants were performed prior to the formation of visible rhombomere boundaries. Cells were removed from donors labeled at the one-cell stage with biotinylated dextran (brown) and transposed either posteriorly (red cell), out of the hoxa2 expression domain (red) and into the hoxb3 expression domain (green) or anteriorly (green cell). (B) 20 h, left side view. In situ hybridization to detect hoxb3 mRNA (blue) in rhombomeres (r5, r6) and neural crest (nc). (C, D) Dorsal views of embryos labeled first by in situ hybridization for hoxb3 and subsequently by peroxidase detection of the biotinylated lineage tracer in transplanted cells (brown). (C) Single cell transplanted anteriorly in the neural crest (arrow). (D) A single cell transplanted anteriorly in the hindbrain (arrow). Abbreviations: ot, otic capsule; r, rhombomere; nc, neural crest. |
|
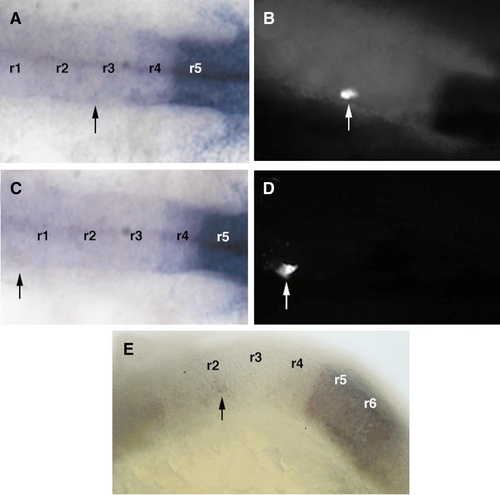
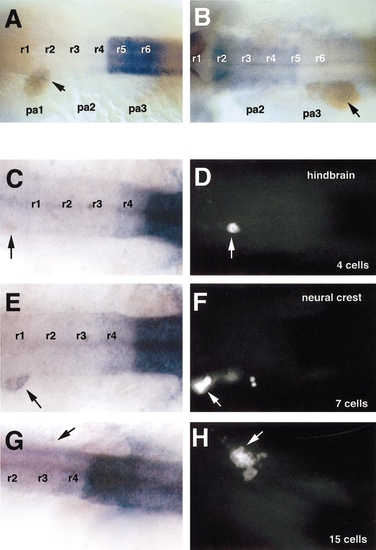
Colocalization of hoxb3 expression and the lineage tracer with fluorescence in cells within the neural tube. (A, C) Dorsal views of embryonic hindbrains at 20 h, labeled by in situ hybridization for hoxb3 (arrows indicate positions of transplanted cells). (B, D) Corresponding locations of transplanted cells visualized with a fluorescent peroxidase substrate. (E) Lateral view of an exceptional case in which a single cell transposed anteriorly to the r2 level maintained hoxb3 expression (arrow). Rhombomeres are numbered (r1– 6). |
|
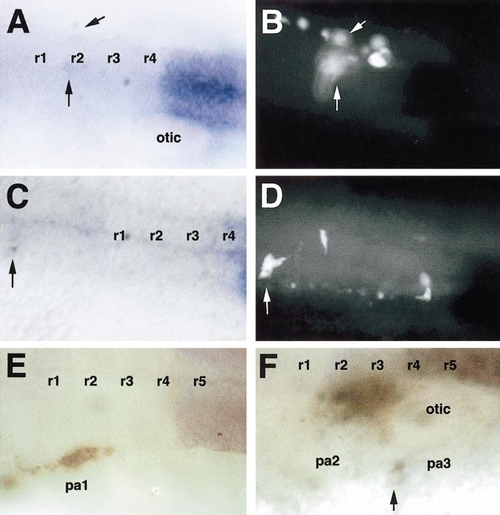
Colocalization of hoxb3 expression and lineage tracer in transplanted neural crest cells. (A, C) Dorsal views of embryos at 20 h colabeled for hoxb3 mRNA by in situ hybridization (blue). (B, D) Corresponding locations of cells labeled with the biotinylated lineage tracer. (E) Dorsal view of a cluster of neural crest cells transposed from the r5/6 level to the r2/3 level and migrating in the first pharyngeal arch (pa1) that were all hoxb3 negative, as determined by the initial in situ hybridization. (F) Left side view of neural crest cells transplanted from the r2/3 level to the r5/6 level and migrating in the third pharyngeal arch (pa3), one of which has become strongly hoxb3 positive (arrow). Rhombomeres are numbered. |
|
Transplanted cells from the hoxa2-negative r6/r7 level upregulate expression of hoxa2 when placed at r4/r5 levels, but not elsewhere. Left side (A, C, D) or dorsal (B) views. Transplanted cells were detected for biotinylated lineage tracer (brown) after gene expression was assayed by in situ hybridization. (A) Transplanted cells contributing to the second pharyngeal arch (pa2) stream of hoxa2+ migrating neural crest express hoxa2. (B) Transplanted cells contributing to the first (pa1) and second (pa2) arch streams express hoxa2 only in the second arch. (C) Transplanted cells contributing to the second and more posterior arches express hoxa2 in the second (pa2) arch. (D) Cells transplanted from r4/r5 levels into the first pharyngeal arch (pa1) are hoxa2-negative. |
|
Maintenance of hox expression depends on transplant size. (A, B) Dorsal views of 20-h embryos labeled with hoxb3 (A) or hoxa2 (B) and biotinylated lineage tracer detected with peroxidase (brown). (C–H) Left shows dorsal views of hoxb3 expression and arrows indicate locations of transplants; right shows corresponding locations of transplanted cells visualized by fluorescein fluorescence. (A–D) Hindbrain cells. (E–H) Neural crest cells. Rhombomeres are numbered (r1– 6). |
|
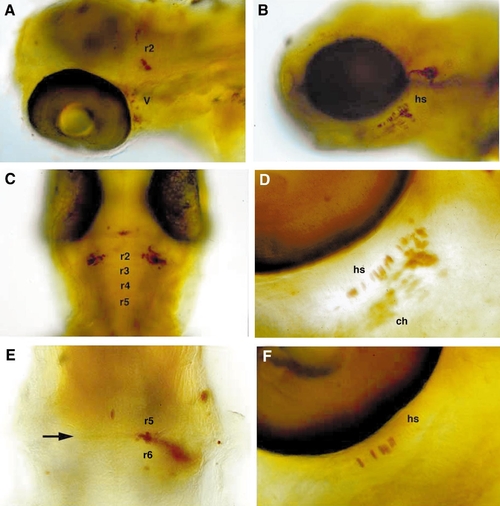
Cells transplanted along the AP axis regulate their segment-specific skeletal and neural fates. 72-h-old larvae containing transplants were stained for the biotinylated lineage tracer (brown). Left (A, C, E) shows neural derivatives; right (B, D, F) shows skeletal derivatives. (A) Dorsolateral view of cells transposed from r5/6 to r2. Some neural crest cells contained in the same transplant contributed neurons to the trigeminal ganglion of the first arch (V). (B) Lateral view of neural crest transplanted from the r5/6 level to the r3/4 level that contributed to the hyosymplectic cartilage (hs) of the second arch. (C) Dorsal view (anterior to the top) of cells transposed from r5/6 to r2 that contributed bilaterally to r2. (D, F) Ventrolateral views of cells transplanted from r5/6 (D) or r7 (F) that contributed to second arch cartilages. (E) Dorsal view (anterior to the top) of commissural interneurons between r5 and r6, transposed posteriorly from r2/3. Abbreviations: hs, hyosymplectic; ch, ceratohyal; V, trigeminal ganglion. |
Reprinted from Developmental Biology, 229, Schilling, T.F., Prince, V., and Ingham, P.W., Plasticity in zebrafish hox expression in the hindbrain and cranial neural crest, 201-216, Copyright (2001) with permission from Elsevier. Full text @ Dev. Biol.

