
|
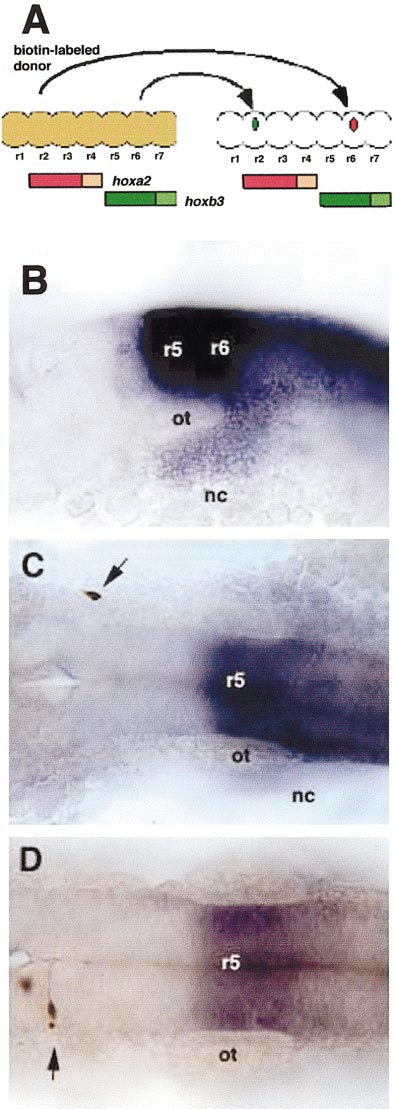
Fig. 3 Single-cell transplantation to test plasticity in hox expression. (A) Diagram of a dorsal view of the neural tube illustrating the transplantation technique. Rhombomere levels (r1–7) are indicated as bulges, though transplants were performed prior to the formation of visible rhombomere boundaries. Cells were removed from donors labeled at the one-cell stage with biotinylated dextran (brown) and transposed either posteriorly (red cell), out of the hoxa2 expression domain (red) and into the hoxb3 expression domain (green) or anteriorly (green cell). (B) 20 h, left side view. In situ hybridization to detect hoxb3 mRNA (blue) in rhombomeres (r5, r6) and neural crest (nc). (C, D) Dorsal views of embryos labeled first by in situ hybridization for hoxb3 and subsequently by peroxidase detection of the biotinylated lineage tracer in transplanted cells (brown). (C) Single cell transplanted anteriorly in the neural crest (arrow). (D) A single cell transplanted anteriorly in the hindbrain (arrow). Abbreviations: ot, otic capsule; r, rhombomere; nc, neural crest.
Reprinted from Developmental Biology, 229, Schilling, T.F., Prince, V., and Ingham, P.W., Plasticity in zebrafish hox expression in the hindbrain and cranial neural crest, 201-216, Copyright (2001) with permission from Elsevier. Full text @ Dev. Biol.