
|
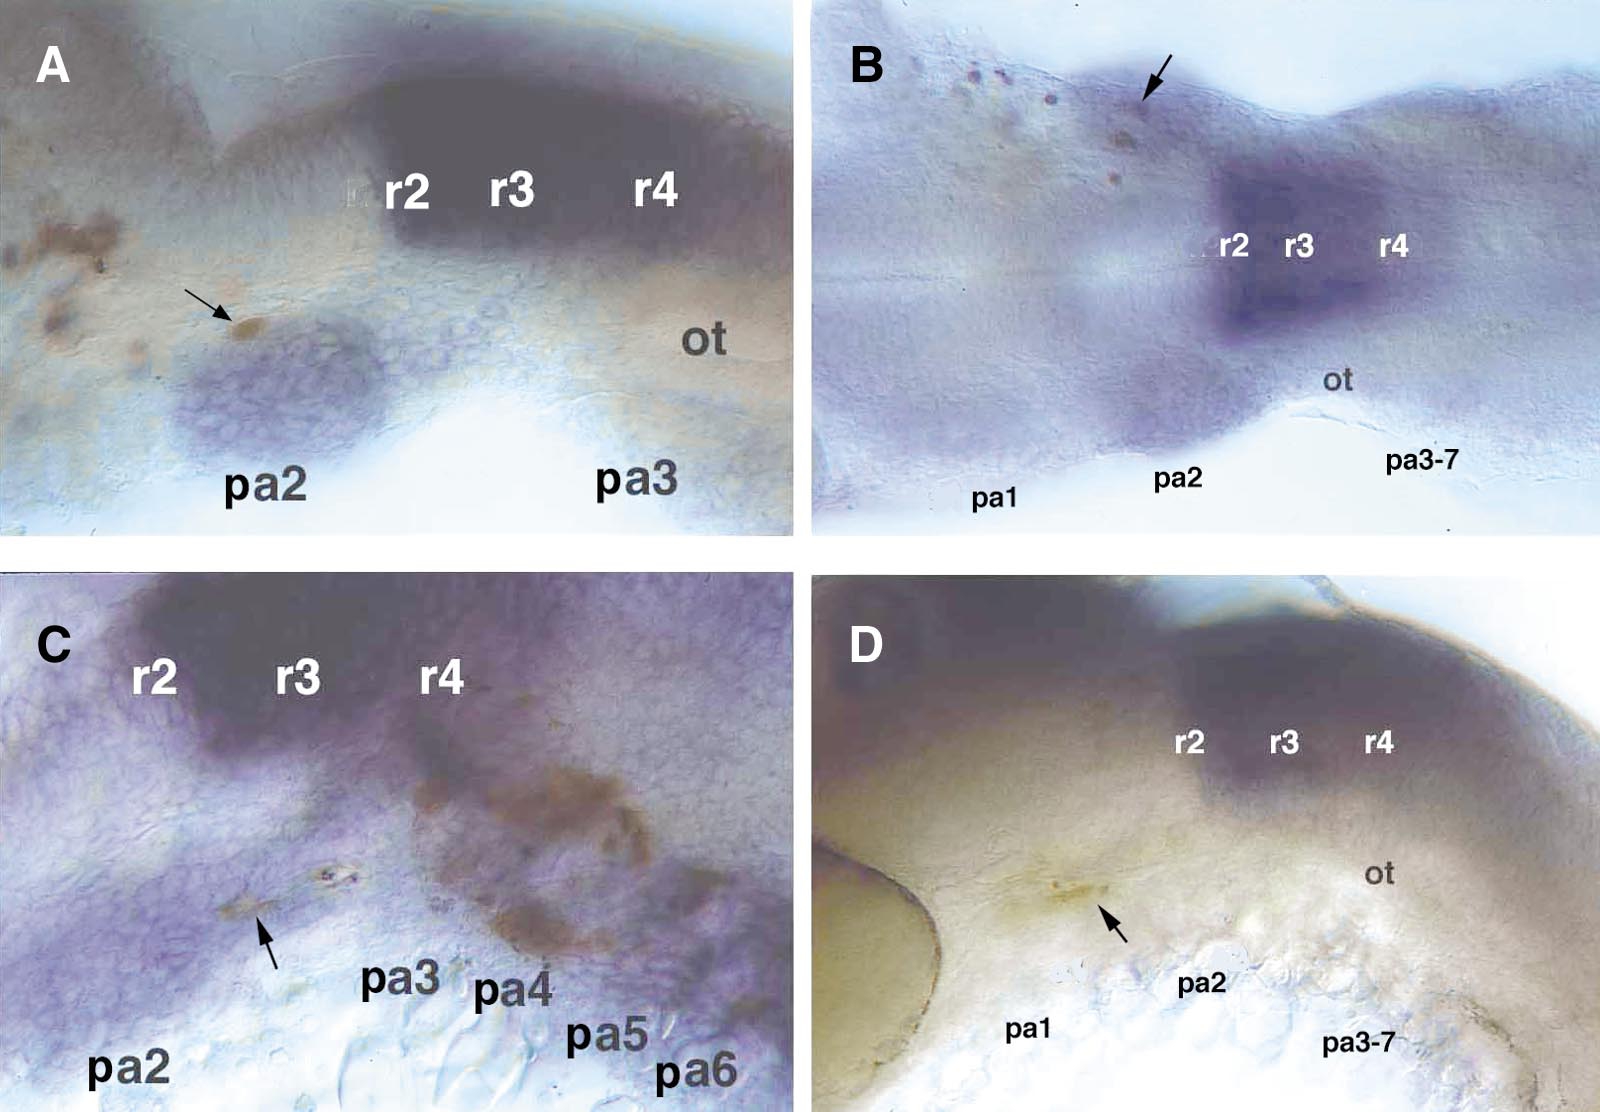
Fig. 6 Transplanted cells from the hoxa2-negative r6/r7 level upregulate expression of hoxa2 when placed at r4/r5 levels, but not elsewhere. Left side (A, C, D) or dorsal (B) views. Transplanted cells were detected for biotinylated lineage tracer (brown) after gene expression was assayed by in situ hybridization. (A) Transplanted cells contributing to the second pharyngeal arch (pa2) stream of hoxa2+ migrating neural crest express hoxa2. (B) Transplanted cells contributing to the first (pa1) and second (pa2) arch streams express hoxa2 only in the second arch. (C) Transplanted cells contributing to the second and more posterior arches express hoxa2 in the second (pa2) arch. (D) Cells transplanted from r4/r5 levels into the first pharyngeal arch (pa1) are hoxa2-negative.
Reprinted from Developmental Biology, 229, Schilling, T.F., Prince, V., and Ingham, P.W., Plasticity in zebrafish hox expression in the hindbrain and cranial neural crest, 201-216, Copyright (2001) with permission from Elsevier. Full text @ Dev. Biol.