
|
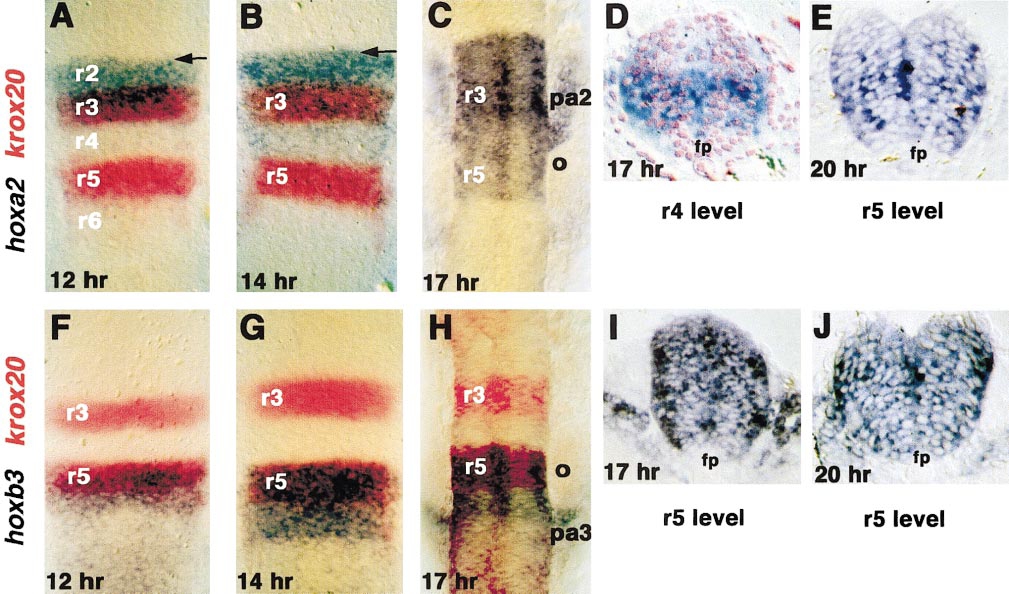
Fig. 2 Dynamic changes in hox expression in the embryonic hindbrain and neural crest. Whole-mount in situ hybridizations and transverse sections for (A–E) hoxa2 and (F–J) hoxb3. A, B, and F–H show double in situs with krox20 (red) as a marker of r3 and r5; all whole mounts are shown in dorsal view with anterior to the top. (A) At 12 h (5 somites) hoxa2 is expressed in r2 and r3 with diffuse limits (e.g., as marked by arrow at presumptive r1/r2 boundary). (B) At 14 h (10 somites) the anterior expression limit has sharpened (arrow) and low level expression is apparent in r4 and r5. (C) At 17 h (16 somites) expression is also apparent in the neural crest stream, migrating out to the second pharyngeal arch (pa2). (D) Transverse section through the r4 level at 17 h reveals that hoxa2 expression is limited to the ventral half of the keel; this sample is counterstained with eosin. (E) Transverse section through the r5 level at the 20 h shows reduced hoxa2 expression in the floor plate (fp). (F) At 12 h hoxb3 is expressed in r5 and r6 and more posteriorly; the anterior limit is diffuse at this stage. (G) At 14 h hoxb3 expression in r5 and r6 has upregulated and the anterior limit is beginning to sharpen. (H) At 17 h expression is apparent in the neural crest migrating out into the third pharyngeal arch. (I, J) Transverse sections through the r5 level at 17 and 20 h show reduced expression levels in the floor plate.
Reprinted from Developmental Biology, 229, Schilling, T.F., Prince, V., and Ingham, P.W., Plasticity in zebrafish hox expression in the hindbrain and cranial neural crest, 201-216, Copyright (2001) with permission from Elsevier. Full text @ Dev. Biol.