
Image
|
Figure Caption
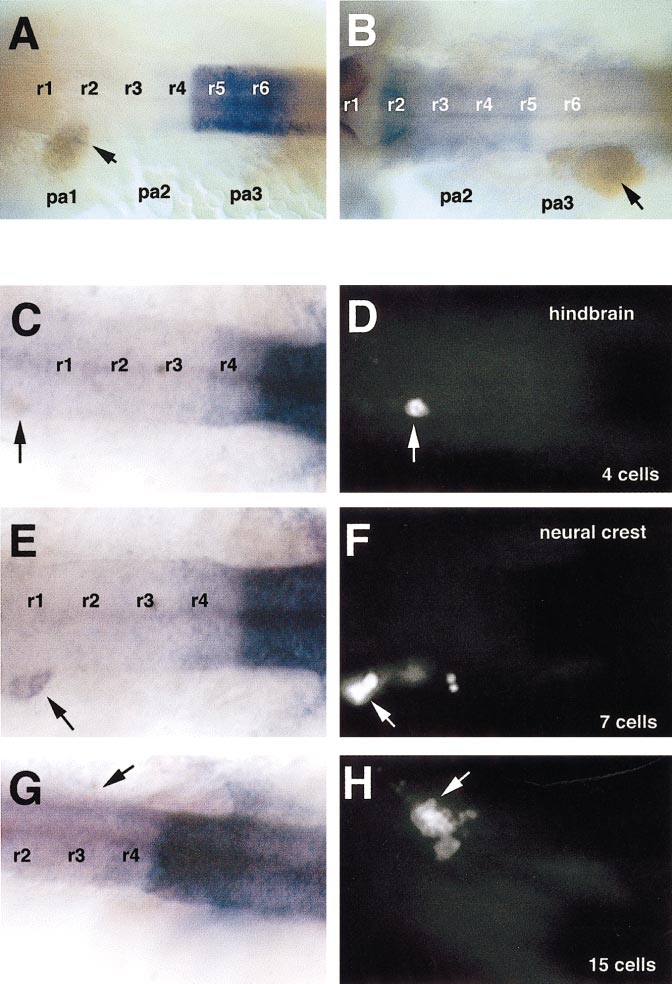
Fig. 7 Maintenance of hox expression depends on transplant size. (A, B) Dorsal views of 20-h embryos labeled with hoxb3 (A) or hoxa2 (B) and biotinylated lineage tracer detected with peroxidase (brown). (C–H) Left shows dorsal views of hoxb3 expression and arrows indicate locations of transplants; right shows corresponding locations of transplanted cells visualized by fluorescein fluorescence. (A–D) Hindbrain cells. (E–H) Neural crest cells. Rhombomeres are numbered (r1– 6).
Acknowledgments
This image is the copyrighted work of the attributed author or publisher, and
ZFIN has permission only to display this image to its users.
Additional permissions should be obtained from the applicable author or publisher of the image.
Reprinted from Developmental Biology, 229, Schilling, T.F., Prince, V., and Ingham, P.W., Plasticity in zebrafish hox expression in the hindbrain and cranial neural crest, 201-216, Copyright (2001) with permission from Elsevier. Full text @ Dev. Biol.