
Image
|
Figure Caption
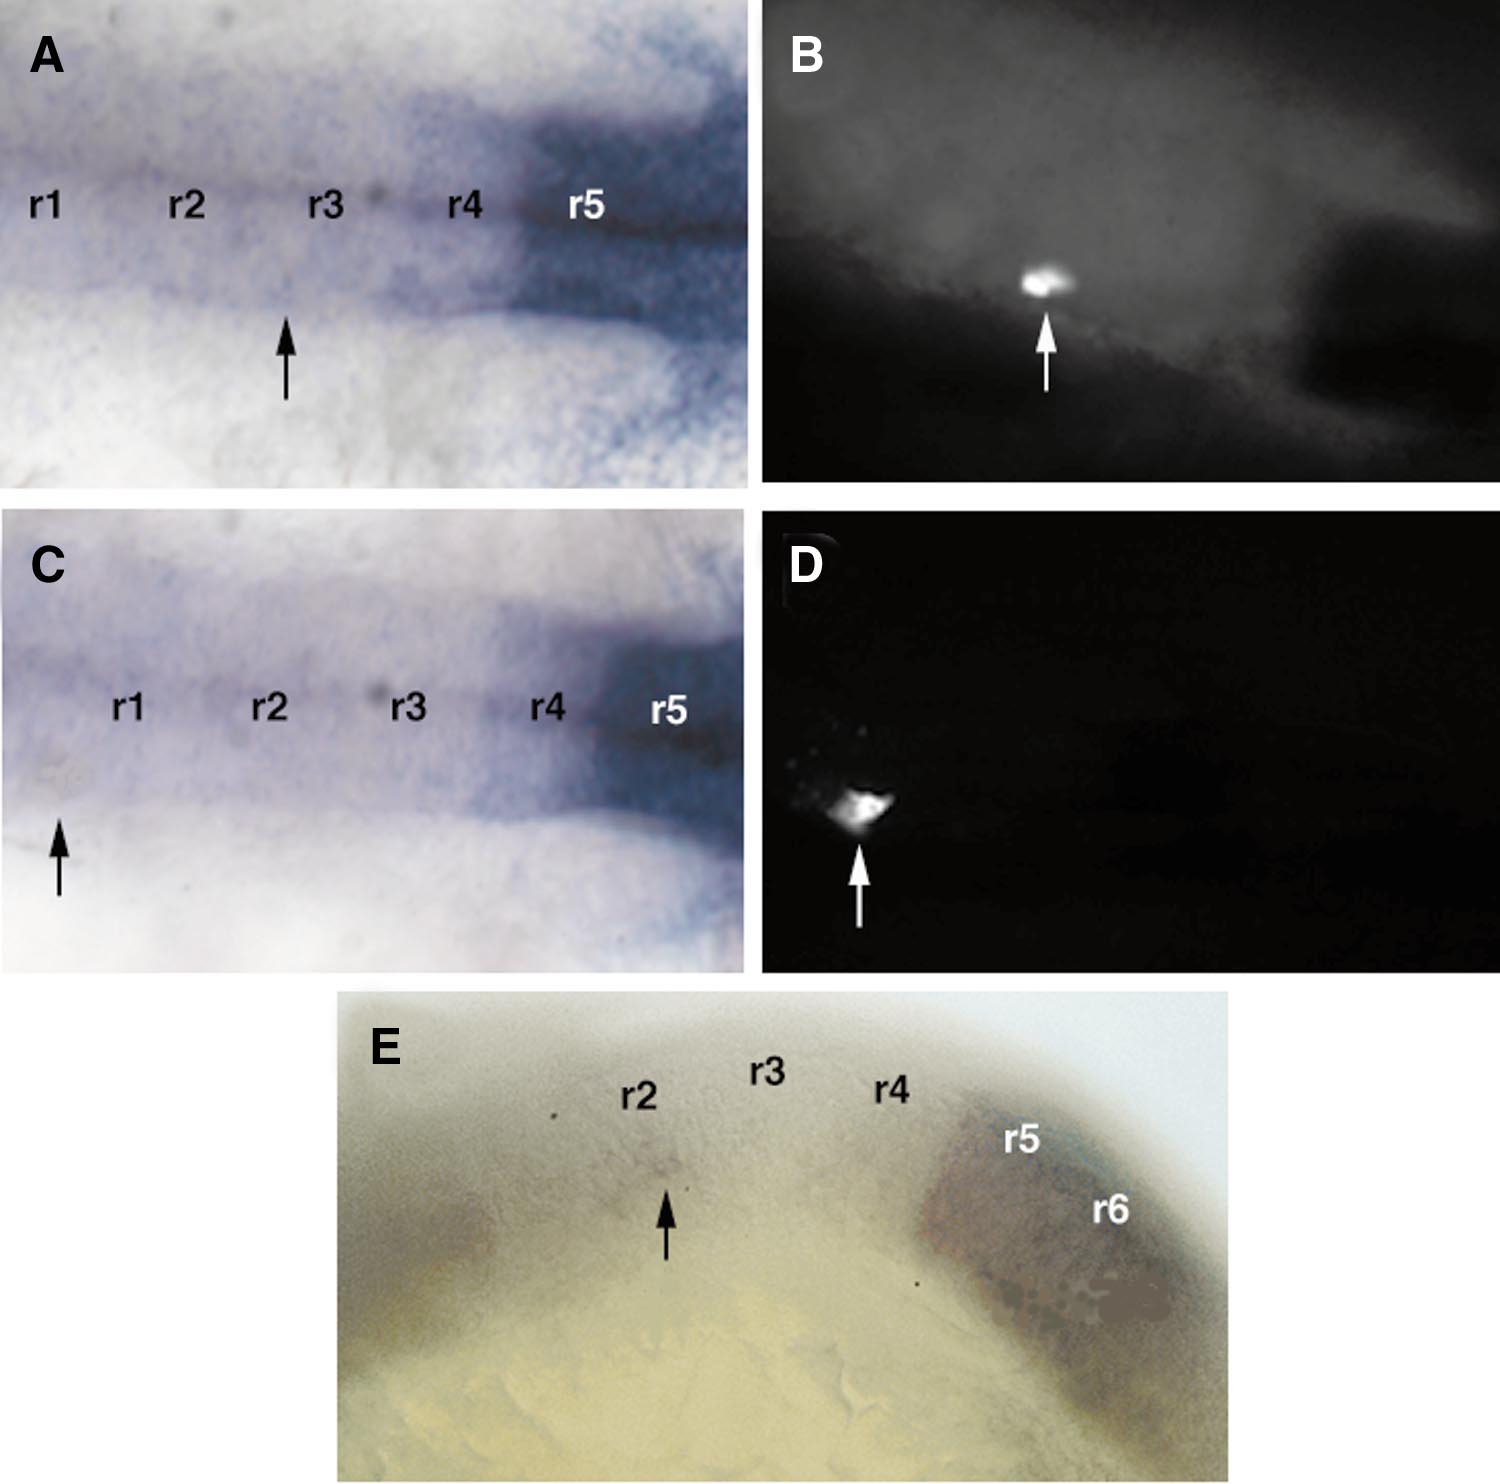
Fig. 4 Colocalization of hoxb3 expression and the lineage tracer with fluorescence in cells within the neural tube. (A, C) Dorsal views of embryonic hindbrains at 20 h, labeled by in situ hybridization for hoxb3 (arrows indicate positions of transplanted cells). (B, D) Corresponding locations of transplanted cells visualized with a fluorescent peroxidase substrate. (E) Lateral view of an exceptional case in which a single cell transposed anteriorly to the r2 level maintained hoxb3 expression (arrow). Rhombomeres are numbered (r1– 6).
Acknowledgments
This image is the copyrighted work of the attributed author or publisher, and
ZFIN has permission only to display this image to its users.
Additional permissions should be obtained from the applicable author or publisher of the image.
Reprinted from Developmental Biology, 229, Schilling, T.F., Prince, V., and Ingham, P.W., Plasticity in zebrafish hox expression in the hindbrain and cranial neural crest, 201-216, Copyright (2001) with permission from Elsevier. Full text @ Dev. Biol.