|
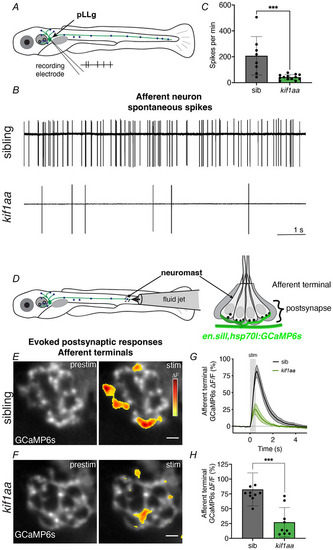
Afferent neurons in kif1aa mutants have fewer spontaneous spikes and reduced evoked responses A, overview of the scheme used to record spontaneous spiking from afferent cell bodies in the posterior lateral‐line ganglion (pLLg). Glass pipettes pulled with long tapers were used to record extracellularly in a loose‐patch configuration. B, representative 10 s traces show spiking in pLLg neurons in sibling control (top) and kif1aa mutant (bottom). C, quantification shows that the average number of spikes per minute in kif1aa mutants is significantly lower than sibling controls (control: 208 ± 149, kif1aa: 42.0 ± 19.7; n = 8 control and 13 kif1aa cells, unpaired t test, P = 0.0007, 3–6 dpf). D, overview of the scheme used to assess evoked calcium responses in the afferent terminals beneath lateral‐line hair cells. A fluid jet is used to deliver flow stimuli to lateral‐line neuromasts. A transgenic line (en.sill,hsp70l:GCaMP6s) expressed in posterior lateral‐line afferents is used to measure fluid jet‐evoked GCaMP6s calcium signals in afferent terminals beneath neuromasts. E–F, top‐down images show optical planes of GCaMP6s in afferent terminals. Heatmaps show spatial representations of ∆ GCaMP signals in afferent terminals during a 500 ms stimulation (stim) compared with pre‐stimulus (prestim) in sibling control and kif1aa mutants. G, traces show the average response in the afferent terminal in sibling control and kif1aa mutants (n = 10 control and 9 kif1aa neuromasts). H, dot plot shows that the average response in the afferent terminal is significantly lower in kif1aa mutants compared with sibling control (control: 82.6 ± 27.9, kif1aa: 27.2 ± 24.7; n = 10 control and 9 kif1aa neuromasts, unpaired t test, P = 0.0003, 4–5 dpf). Scale bars in E,F = 5 µm and 1 s in B.
|