|
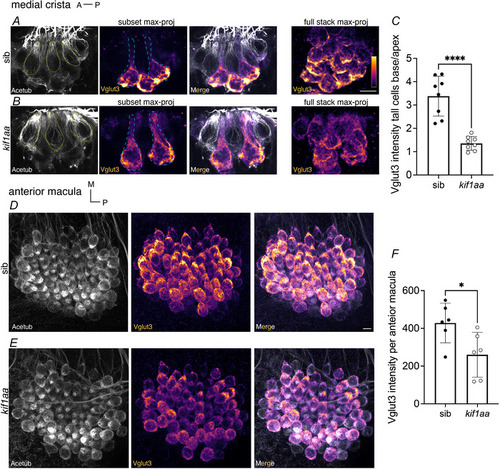
Kif1aa mutants disrupt Vglut3 localization in subsets of inner‐ear hair cells A,B, immunolabel of hair cells in the medial crista with acetylated tubulin (Acetub, grey) to mark hair cells and Vglut3 to mark synaptic vesicles in kif1aa mutants (B) and sibling controls (A) at 5 dpf. In the crista of both kif1aa mutants and controls, only a subset of hair cells (tall cells), show high levels of Vglut3 (cells outlined with cyan dashed lines in A and B). In contrast, other hair cells (tear drop cells) have no detectable Vglut3 (cells outlined with yellow dashed lines in A and B). C, quantification reveals that the Vglut3 label is significantly less enriched at the cell base of tall cells in the cristae of kif1aa mutants compared with sibling controls (control: 3.38 ± 0.86, kif1aa: 1.35 ± 0.29, n = 8 control and kif1aa cristae, unpaired t test, P < 0.0001) (see partial and full stack max‐projected images in A and B). D,E, immunolabel of hair cells in the anterior macula with acetylated tubulin (Acetub, grey) to mark hair cells and Vglut3 to mark synaptic vesicles in kif1aa mutants (D) and sibling controls (E) at 5 dpf. F, in the anterior macula, the mean intensity of Vglut3 immunolabel in the maculae was significantly reduced in kif1aa mutants compared with control (control: 428 ± 105, kif1aa: 260 ± 119, n = 6 control and kif1aa anterior macula, unpaired t test, P = 0.0264). Scale bars in A and D = 5 µm.
|