
Figure 4.
- ID
- ZDB-FIG-230413-8
- Publication
- Goldblatt et al., 2023 - Neuronal birthdate reveals topography in a vestibular brainstem circuit for gaze stabilization
- Other Figures
- All Figure Page
- Back to All Figure Page
Projection neurons are assembled into the tangential nucleus in a stereotyped temporal sequence
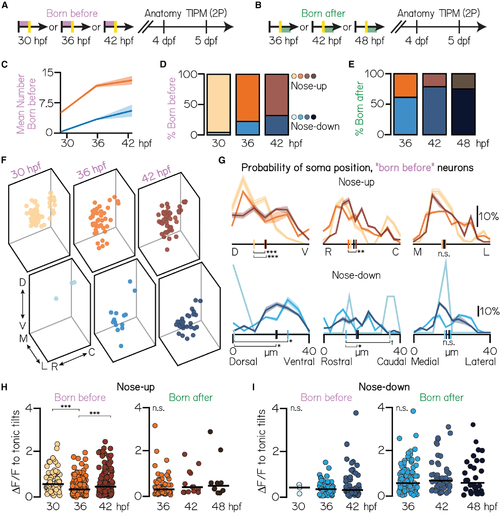
(A) Timeline of functional birthdating experiments. Only projection neurons born before the time of conversion (red, converted Kaede) were analyzed. Projection neurons were visualized using the Tg(−6.7Tru.Hcrtr2:GAL4-VP16) line and expressed both the UAS:Kaede and UAS:GCaMP6s indicators. (B) Timeline of experiments. Only projection neurons born after the time of conversion (green, unconverted Kaede only) were analyzed. (C) Mean number of nose-up and nose-down neurons born before each age. Distributions shown are the mean (solid) and standard deviation (shaded outline) after jackknife resampling. (D) Percent of nose-up and nose-down neurons born before each age. Orange shades, nose-up; blue shades, nose-down. 30 hpf data are from the same N = 7 fish as in Figures 1G, ,1H,1H, ,3B,3B, and and3C.3C. 36 hpf: n = 208 sampled “born before” neurons from N = 7 fish; 42 hpf: n = 198 sampled born before neurons from N = 5 fish. (E) Percent of sampled nose-up and nose-down neurons born after each photoconversion time point. Orange shades, nose-up; blue shades, nose-down. 36 hpf: n = 168 born after neurons from N = 7 fish; 42 hpf: n = 66 born after neurons from n = 5 fish. 48 hpf data same as in Figures 1G, ,1H,1H, ,3B,3B, and and33. (F) Soma position of neurons born before each age. 30 hpf: all data shown. 36 hpf: n = 150/208 randomly selected neurons shown. 42 hpf: n = 150/198 randomly selected neurons shown. (G) Probability of soma position for all born before neurons. Distributions shown are the mean (solid) and standard deviation (shaded outline) after jackknife resampling. Short vertical axis lines indicate the median position of all birthdated neurons, compared with control distributions shown in Figure 1F (black). (H) Maximum change in calcium fluorescence to tonic tilts for nose-up neurons born before (left) or after (right) each age. Each circle represents a unique neuron. Solid line shows the mean across neurons. (I) Maximum change in calcium fluorescence to tonic tilts for nose-down neurons born before or after each age. All data: ***difference at the p < 0.001 level; **significance at p < 0.01; §, significance between p = 0.08 and p = 0.05; n.s., not significant. |