
Figure 3.
- ID
- ZDB-FIG-230413-7
- Publication
- Goldblatt et al., 2023 - Neuronal birthdate reveals topography in a vestibular brainstem circuit for gaze stabilization
- Other Figures
- All Figure Page
- Back to All Figure Page
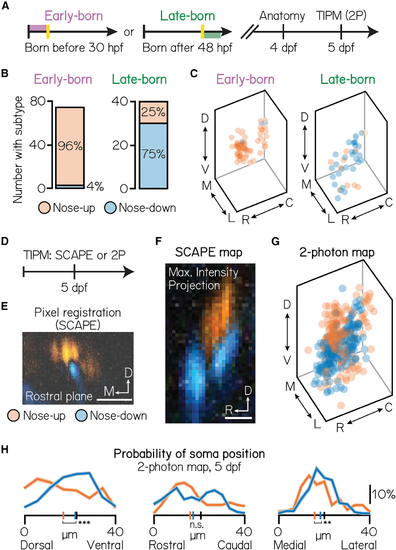
Birthdating reveals functional somatic topography to projection neurons
(A) Timeline of functional birthdating experiments. Larvae were birthdated at either 30 or 48 hpf and then imaged on a confocal (4 dpf) and two-photon (5 dpf) to identify projection neuron soma position, birthdate, and directional (up/down) identity. Projection neurons were visualized using the Tg(−6.7Tru.Hcrtr2:GAL4-VP16) line and expressed both the UAS:Kaede and UAS:GCaMP6s indicators. (B) Number of early- (left) and late-born (right) projection neurons with each directional subtype identity. Data from same neurons shown in Figure 1. (C) Soma position of early- (left) and late-born (right) neurons, pseudocolored according to directional identity. Data from same neurons shown in Figure 1. (D) Timeline of topography validation experiments. TIPM was performed on non-birthdated larvae at 5 dpf as shown in Figure 2B, using either a SCAPE or two-photon microscope. Projection neurons were visualized using the Tg(−6.7Tru.Hcrtr2:GAL4-VP16) line and expressed only the UAS:GCaMP6s indicator. (E) Registration method for SCAPE experiments. Pixels are pseudocolored according to the direction that evoked a stronger response. One example rostral plane shown. (F) Maximum intensity projection of the entire tangential nucleus from one fish imaged with SCAPE, pseudocolored as described in Figure 3E. (G) Soma position of neurons imaged with two-photon TIPM, pseudocolored by directional identity. Soma registered using method shown in Figure 1E. Data from the same n = 467, N = 22 fish as in Figures 2C–2E. (H) Probability of soma position for nose-up (orange) and nose-down (blue) projection neurons from two-photon TIPM. Distributions shown are the mean (solid) and standard deviation (shaded outline) after jackknife resampling. Short vertical axis lines indicate the median position of up/down projection neurons, compared with control distributions shown in Figure 1F (black). ***difference between the nose-up and nose-down distributions at the p < 0.001 level; **significance at p < 0.01; n.s., not significant. See also Figure S4. |