
Figure 1.
- ID
- ZDB-FIG-230413-5
- Publication
- Goldblatt et al., 2023 - Neuronal birthdate reveals topography in a vestibular brainstem circuit for gaze stabilization
- Other Figures
- All Figure Page
- Back to All Figure Page
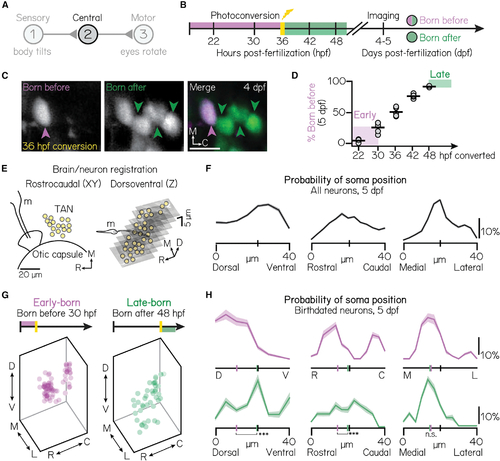
Projection neuron birthdate predicts soma position
(A) Schematic of the vestibulo-ocular reflex circuit used for gaze stabilization. (B) Timeline of birthdating experiments. Neurons born by the time of photoconversion have both magenta (converted) and green (unconverted) Kaede. Neurons born after photoconversion have exclusively green (unconverted) Kaede. All fish are imaged well after photoconversion, at 4–5 days post-fertilization (dpf). (C) Example projection neurons photoconverted at 36 hpf, visualized using the Tg(−6.7Tru.Hcrtr2:GAL4-VP16; UAS-E1b:Kaede) line. Magenta and green arrows indicate neurons born before or after 36 hpf, respectively. Scale bars (white), 20 μm.). (D) Percent of projection neurons born at each time point. Black lines indicate the mean percent across individual fish (circles). Shaded bars indicate cohorts designated as early-born (converted by/born before 30 hpf) or late-born (unconverted at/born after 48 hpf). n = 5 hemispheres/time point from at least N = 3 larvae (22–42 hpf) or n = 3 hemispheres from N = 3 larvae (48 hpf).). (E) Schematic of brain/neuron registration in the rostrocaudal/xy (left) and dorsoventral/z (right) axes. Black solid lines outline anatomical landmarks used for registration. Yellow circles indicate the position of individual projection neurons. m, Mauthner neuron.). (F) Soma positions of n = 660 registered neurons from N = 10 non-birthdated fish at 5 dpf. Probability distributions shown are the mean (solid) and standard deviation (shaded outline) after jackknife resampling. Short vertical axis lines indicate the median position of all registered neurons.). (G) Soma position of birthdated projection neurons. Early-born (left): n = 74 neurons from N = 7 fish. Late-born (right): n = 41 neurons from N = 10 fish.). (H) Same data as Figure 1G, shown as probability distributions for each spatial axis. Distributions shown are the mean (solid) and standard deviation (shaded outline) after jackknife resampling. Short vertical axis lines indicate the median position of early- (magenta) or late-born (green) projection neurons, compared with control distributions shown in Figure 1F (black). ***difference between the early- and late-born probability distributions at the p < 0.001 level; *significance at p < 0.05; n.s., not significant.). See also Figure S1. |