
Fig. 6
- ID
- ZDB-FIG-220923-99
- Publication
- Bensimon-Brito et al., 2021 - Integration of multiple imaging platforms to uncover cardiovascular defects in adult zebrafish
- Other Figures
- All Figure Page
- Back to All Figure Page
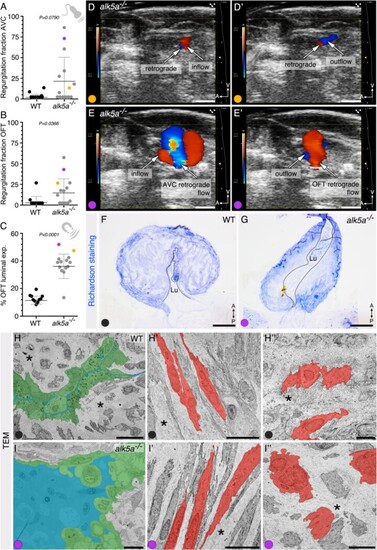
Combined imaging analyses facilitate the selection of specific phenotypes for high resolution morphological characterization. (A–C) Regurgitation fraction as obtained by echocardiography (A, B) and OFT luminal expansion as obtained by MRI (C) for two zebrafish (orange and purple, n = 2) plotted against the previously measured zebrafish (WT, black, n = 10; alk5a–/– grey, n = 12). Plots show the values for each individual and the mean ± SD; P-values were determined by Mann–Whitney test. Purple dot identifies the zebrafish selected for subsequent analysis with transmission electron microscopy (TEM). (D–E’) alk5a–/– zebrafish showing mild (orange, D, D’) and severe (purple, E, E’) regurgitation fraction in the AVC and OFT regions. (F, G) Semi-thin sections of WT and alk5a–/– OFTs stained with Richardson staining solution. Dashed line outlines the OFT lumen (Lu). (H–I”) TEM images of WT and alk5a–/– OFTs, showing the OFT lumen in blue, lined by ECs in green (H, I) and the OFT wall (H’, H”, I’, I”), including SMCs (red) and ECM (asterisk). Scale bars: 1 mm (D–E’), 200 µm (F, G), 5 µm (H), 10 µm (H’–I”). |
| Fish: | |
|---|---|
| Observed In: | |
| Stage: | Adult |