
Fig. 7
- ID
- ZDB-FIG-220923-100
- Publication
- Bensimon-Brito et al., 2021 - Integration of multiple imaging platforms to uncover cardiovascular defects in adult zebrafish
- Other Figures
- All Figure Page
- Back to All Figure Page
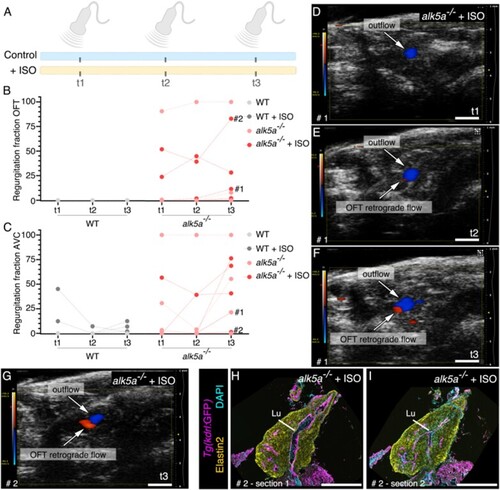
Sequential in vivo measurements allow the observation of phenotype progression. (A) Experimental setup for the sequential monthly measurements (t1, t2, t3) performed with echocardiography in WT and alk5a–/– in control conditions (n = 7 WT, n = 6 alk5a–/–) and upon treatment with isoprenaline (+ISO; n = 7 WT, n = 7 alk5a–/–). (B–F) Graphs showing changes in OFT (B) and AVC (C) regurgitation in WT and alk5a–/– adult zebrafish untreated or treated with isoprenaline. (G–I) Zebrafish # 2, which displays the most pronounced increase in the regurgitation fraction in the OFT from t1 to t3 (G), presented an enlarged OFT lumen in some histological sections (H) but not in others (I). Scale bars: 1 mm (D–G), 400 µm (H, I). |
| Fish: | |
|---|---|
| Condition: | |
| Observed In: | |
| Stage: | Adult |