
Fig. 4
- ID
- ZDB-FIG-220923-97
- Publication
- Bensimon-Brito et al., 2021 - Integration of multiple imaging platforms to uncover cardiovascular defects in adult zebrafish
- Other Figures
- All Figure Page
- Back to All Figure Page
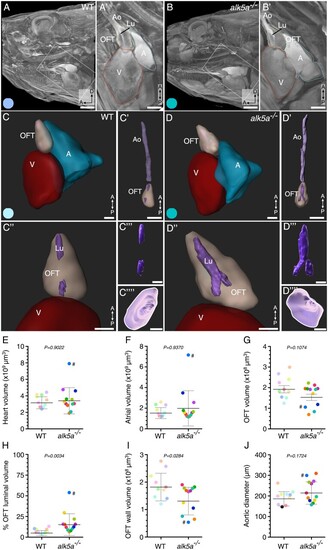
µ-CT analyses of cardiovascular morphology in alk5a–/– adult zebrafish reveal OFT defects. (A, B) µ-CT scans showing a sagittal plane of the anterior region of WT and alk5a–/– adult zebrafish. Boxed area is shown in A’ and B’. Dashed lines outline cardiac compartments. (C–D””) 3D reconstructions of the cardiac compartments in WT (C–C””) and alk5a–/– (D–D””) zebrafish, including the aorta (C’, D’) and OFT lumen (Lu; C’”, D’”). (C””, D””) 3D reconstructions of the aortic opening (white line) as seen from the OFT. (E–J) Quantification of morphological parameters for each cardiac compartment in WT (n = 10) and alk5a–/– (n = 12) zebrafish. Plots show the values for each individual and the mean ± SD; P-values were determined by unpaired t-test (G–J) or Mann–Whitney test (E, F). The colour of each dot refers to the same zebrafish across all graphs and images. The dot adjacent to the number symbol (#) identifies the individual zebrafish mentioned in the text. A, atrium; Ao, aorta; OFT, outflow tract; V, ventricle. Scale bars: 1 mm (A, B), 500 µm (A’, B’), 300 µm (C, D’), 400 µm (C”–D””). |
| Fish: | |
|---|---|
| Observed In: | |
| Stage: | Adult |