
Fig. 1
- ID
- ZDB-FIG-220127-3
- Publication
- Nord et al., 2021 - Genetic compensation between Pax3 and Pax7 in zebrafish appendicular muscle formation
- Other Figures
- All Figure Page
- Back to All Figure Page
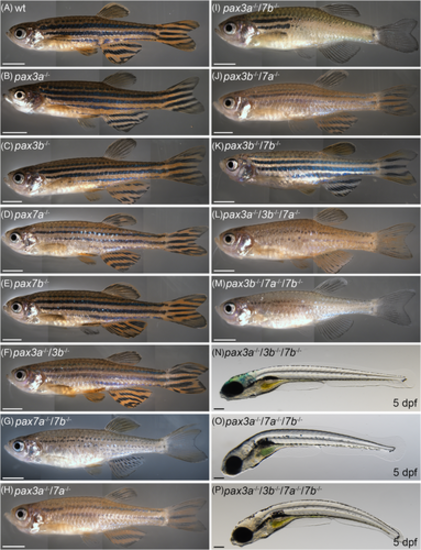
pax3 and pax7 mutant phenotypes. Lateral view of adult (3-12 months), A, wt (n = 40) and, B, pax3a−/− (n = 12), C, pax3b−/− (n = 8), D, pax7a−/− (n = 12), E, pax7b−/− (n = 17), single-mutant zebrafish and, F, pax3a−/−/3b−/− (n = 25), G, pax7a−/−/7b−/− (n = 15), H, pax3a−/−/7a−/− (n = 6), I, pax3a−/−/7b−/− (n = 6), J, pax3b−/−/7a−/− (n = 13), K, pax3b−/−/7b−/− (n = 8) double mutant zebrafish and, L, pax3a−/−/3b−/−/7a−/− (n = 4) and, M, pax3b−/−/7a−/−/7b−/− (n = 4) triple mutant zebrafish. Lateral view of, N, pax3a−/−/3b−/−/7b−/− (n = 10) and, O, pax3a−/−/7a−/−/7b−/− (n = 7) triple mutant and, P, pax3a−/−/3b−/−/7a−/−/7b−/− (n = 10) quadruple mutant zebrafish embryos at 5 dpf. Scale bar: A-M: 3 mm and N-P: 200 μm |