|
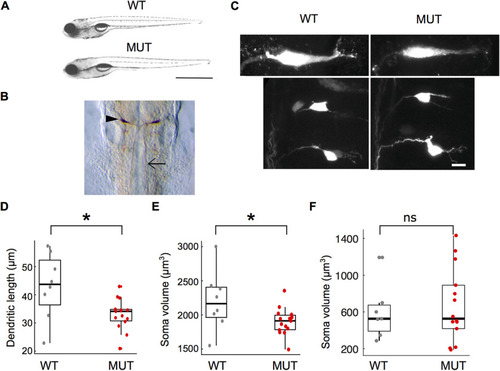
Morphologic characterization of auts2a mutants. A, Bright field images of wild-type (WT) and mutant (MUT) larvae. Scale bar: 2 mm. B, Whole-mount immunostaining with 3A10 antibody at 30 hpf in auts2a mutants. Arrowhead points to the cell body of the Mauthner neuron and arrow points to the axon. C, Maximum intensity Z-projection of Mauther neuron (top) and homologs (bottom) of wild-type (left) and mutant (right) larvae. Scale bar: 10 μm. D, Comparison of Mauthner lateral dendrite lengths in wild-type and auts2a mutant larvae. E, Comparison of Mauthner soma volume in WT and mutant larvae. nWT = 8 cells from 7 larvae; nmut = 15 cells from 12 larvae; *p < 0.05; ns: not significant; Mann–Whitney U test. F, Comparison of soma volume of the M-cell homologs. nWT = 7 cells from 5 larvae; nmut = 14 cells from 12 larvae. ns, not significant; Mann–Whitney U test.
|