IMAGE

Figure 2.

ID
ZDB-IMAGE-211014-3
Antibodies
Source
Figures for Jha et al., 2021
Image
Figure Caption

Figure 2.

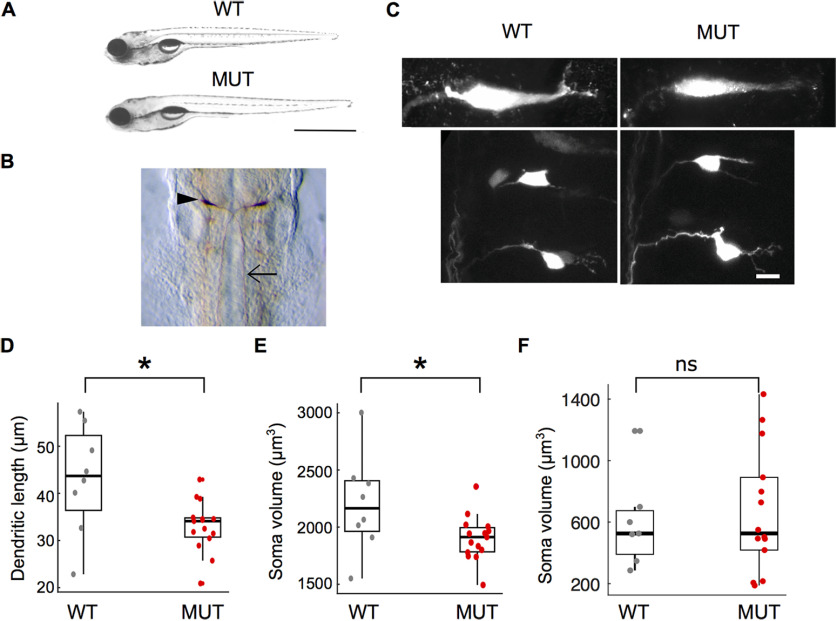
Morphologic characterization of auts2a mutants. A, Bright field images of wild-type (WT) and mutant (MUT) larvae. Scale bar: 2 mm. B, Whole-mount immunostaining with 3A10 antibody at 30 hpf in auts2a mutants. Arrowhead points to the cell body of the Mauthner neuron and arrow points to the axon. C, Maximum intensity Z-projection of Mauther neuron (top) and homologs (bottom) of wild-type (left) and mutant (right) larvae. Scale bar: 10 μm. D, Comparison of Mauthner lateral dendrite lengths in wild-type and auts2a mutant larvae. E, Comparison of Mauthner soma volume in WT and mutant larvae. nWT = 8 cells from 7 larvae; nmut = 15 cells from 12 larvae; *p < 0.05; ns: not significant; Mann–Whitney U test. F, Comparison of soma volume of the M-cell homologs. nWT = 7 cells from 5 larvae; nmut = 14 cells from 12 larvae. ns, not significant; Mann–Whitney U test.

Figure Data
Acknowledgments
This image is the copyrighted work of the attributed author or publisher, and ZFIN has permission only to display this image to its users. Additional permissions should be obtained from the applicable author or publisher of the image. Full text @ eNeuro