
- Title
-
High behavioural variability mediated by altered neuronal excitability in auts2 mutant zebrafish
- Authors
- Jha, U., Kondrychyn, I., Korzh, V., Thirumalai, V.
- Source
- Full text @ eNeuro
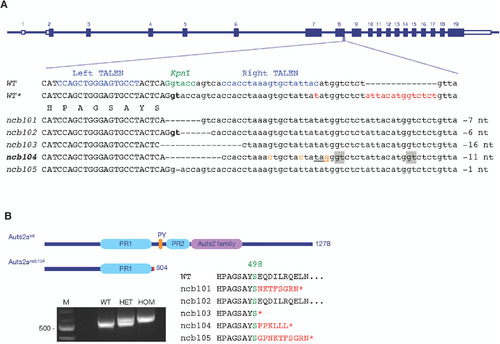
TALEN-induced mutation in the |
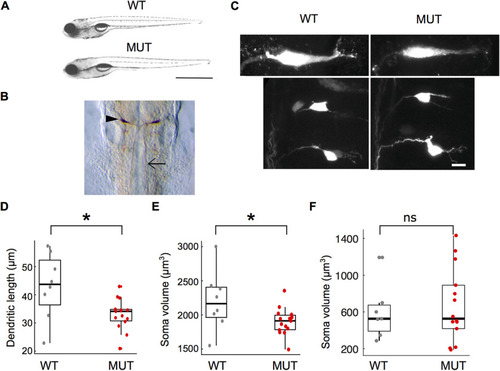
Morphologic characterization of |
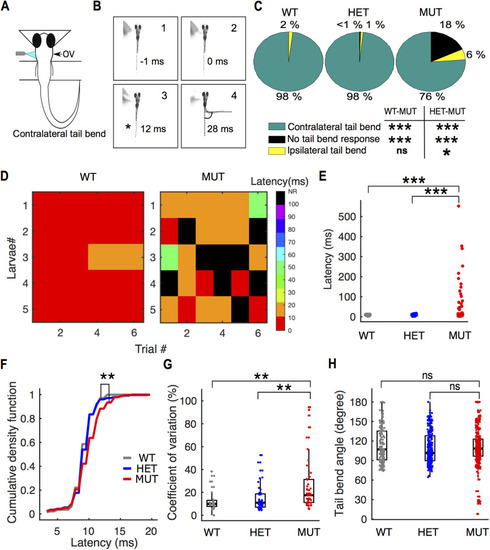
Onset of escape response is delayed and highly variable in |
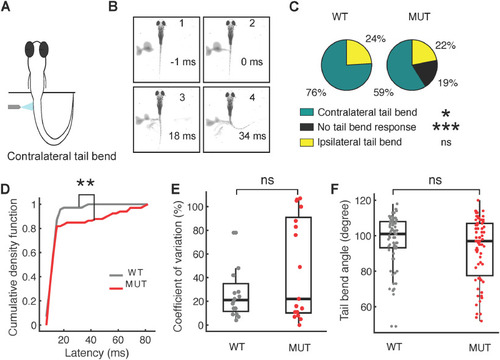
Escape response defects in |
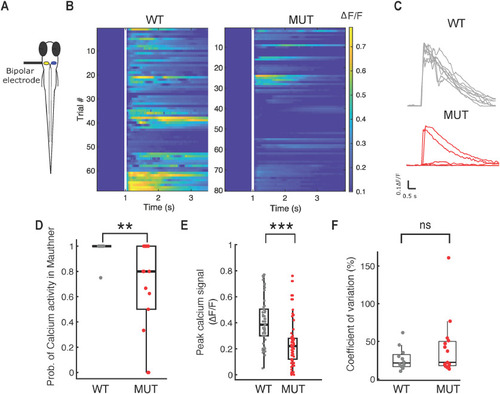
Mauthner neuron fails to fire reliably in PHENOTYPE:
|
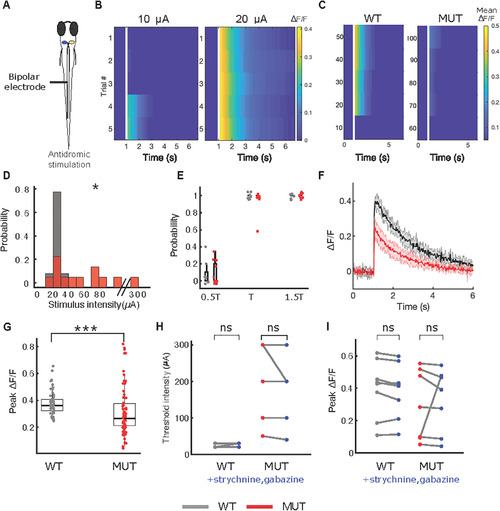
Mauthner neuron in PHENOTYPE:
|
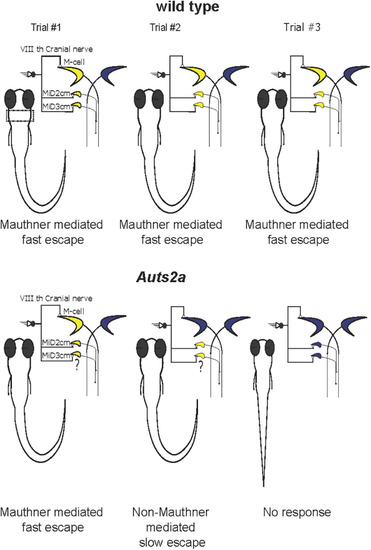
Summary of behavioral abnormalities in escape response in |