FIGURE

Figure 4.

ID
ZDB-FIG-211014-5
Publication
Jha et al., 2021 - High behavioural variability mediated by altered neuronal excitability in auts2 mutant zebrafish
Other Figures
All Figure Page
Back to All Figure Page
Figure 4.

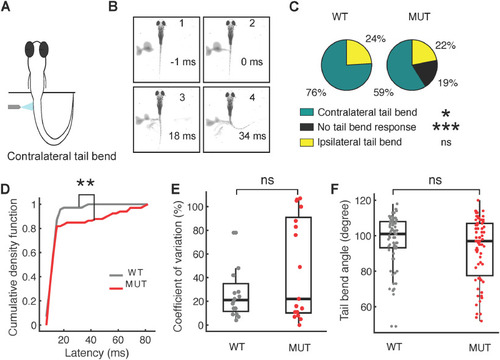
Escape response defects in auts2a mutants persist on changing the location of sensory stimulation. A, Schematic of experimental set up. B, Time lapse of escape response evoked by tail stimulation. (1) Prestimulus frame. (2) Water jet makes first contact with the tail. (3) First visible tail contraction (marked with asterisk). (4) Representative frame for maximum tail bend angle calculation. C, Pie chart showing percentage of contralateral tail bends, ipsilateral tail bends, and failures to initiate an escape response between wild type (n = 92 trials) and mutants (n = 113 trials). D, Comparison of escape response latencies on tail stimulation between wild type (n = 71 trials,16 larvae) and auts2a mutants (n = 67 trials, 19 larvae). E, Comparison of CV of latencies across successive trials for each larva between wild-type (n = 17) and mutant (n = 18) groups. F, Maximum tail bend angle of turns for WT (n = 72 trials) and mutants (n = 72 trials); *p < 0.05, **p < 0.005, ***p < 0.0001; ns, not significant.

Expression Data

Expression Detail
Antibody Labeling
Phenotype Data
Fish:
Observed In:
Stage Range: Day 6 to Days 7-13

Phenotype Detail
Acknowledgments
This image is the copyrighted work of the attributed author or publisher, and ZFIN has permission only to display this image to its users. Additional permissions should be obtained from the applicable author or publisher of the image. Full text @ eNeuro