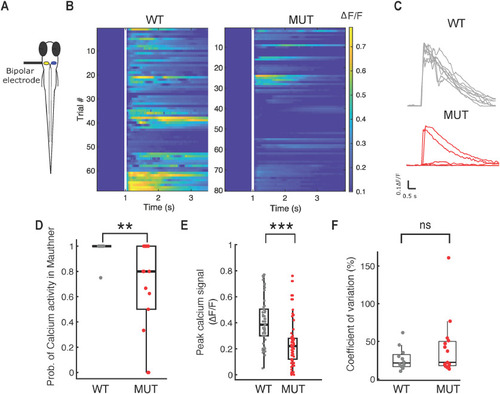
Mauthner neuron fails to fire reliably in auts2a mutants. A, Schematic representation of experimental set up. Mauthner neuron was retrogradely labeled with OGB-1 dextran and calcium activity was monitored on electrical stimulation (40 μA, 1 ms) of OV. B, left, Raster plot of all trials in WT (n = 68 trials; 10 larvae) showing consistent calcium activity across several trials on OV stimulation. Right, Calcium responses observed across all trials in the mutant group (80 trials; 14 larvae). White line represents the time of stimulus delivery. C, top, ΔF/F profile of a Mauthner neuron in an example wild-type larva across eight trials in response to electrical stimulation of the OV. Bottom, ΔF/F profile of a Mauthner neuron in an example auts2a mutant larva showing subthreshold response as well large calcium transients across eight trials on electrical stimulation of OV. D, Probability of calcium activity response across trials per larva (nWT = 10 larvae, nMUT = 14 larvae). E, Peak ΔF/F in WT and mutants (nWT = 68 trials, nMUT = 80 trials). F, Comparison of CV of peak ΔF/F between wild-type and mutant larvae. Mann–Whitney U test; **p < 0.01, ***p < 0.0001, ns: not significant.
|
