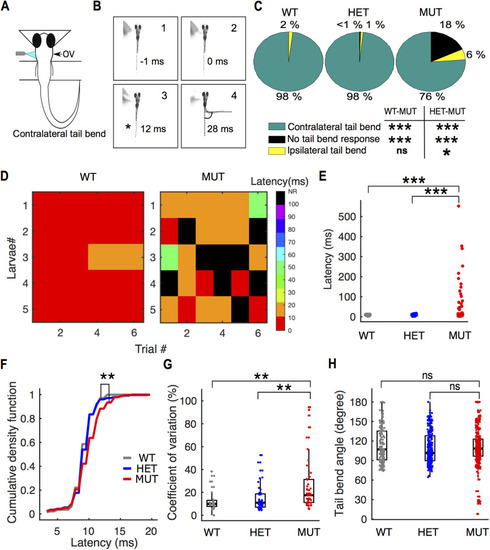
Onset of escape response is delayed and highly variable in auts2a mutants. A, Schematic of experimental set up. Escape response was evoked in zebrafish larvae (6–8 dpf) by directing a strong water jet at the OV. Escape response is characterized by a large angle tail deflection, contralateral to the direction of water jet. B, Time lapse of escape response. (1) Prestimulus frame. (2) Water jet makes first contact with OV. (3) First visible tail contraction (marked with asterisk). (4) Representative frame showing references used for maximum tail bend angle calculation. C, Pie chart showing percentage of contralateral, ipsilateral, and no tail bend responses observed across wild type (n = 143 trials), heterozygotes (n = 258 trials), and auts2a mutants (n = 371 trials); χ2 test. D, Escape latencies across successive trials from five wild-type and mutant larvae. Color bar represents escape latencies. NR: no response. E, Comparison of escape response latencies in wild type (WT), heterozygotes (HET), and auts2a mutants (MUT). nWT = 140 trials from 24 larvae, nHET = 254 trials from 43 larvae and nMUT = 292 trials from 57 larvae. F, Cumulative density function plot for short-latency escapes (latencies ≤20 ms) in wild type (n = 140 trials), heterozygotes (n = 254 trials), and auts2a mutants (n = 273 trials). G, CV of latencies across successive trials in individual larvae for wild type (n = 24), heterozygotes (n = 43), and mutants (n = 53) groups. H, Comparison of maximum tail bend angle of contralateral turns between the three groups (n = 140 trials, WT; n = 254 trials, HET; n = 281 trials, mutants). Kruskal–Wallis; Mann–Whitney test for between-groups comparisons with Bonferroni correction for multiple comparisons, *p < 0.025, **p < 0.005, ***p < 0.0005; ns, not significant.
|
