|
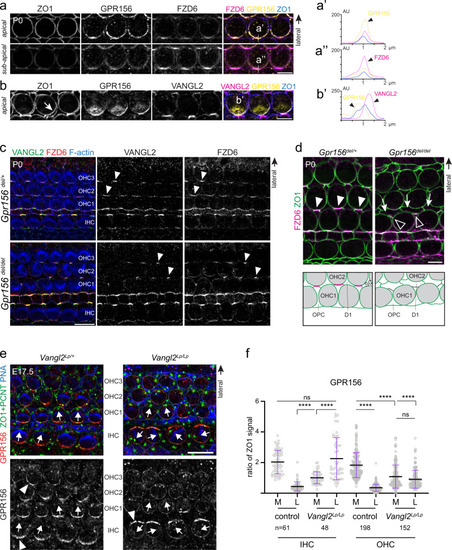
Relationship between GPR156 and core PCP factors at the medial HC junction in the cochlea.a, b P0 wild-type OHC2s. GPR156 co-labeling with ZO1 and either FZD6 (a) or VANGL2 (b). a GPR156 and FZD6 overlap at the medial junction, but the bulk of GPR156 is planar polarized at ZO1 level (top panels; apical), above the bulk of FZD6 (bottom panels; sub-apical, 0.4 µm more basally in the same confocal stack). b VANGL2 is mostly enriched on the support cell side of the medial HC junction, as apparent when TCA fixation separates the OHC and support cell plasma membranes (arrow). a′, a″, and b′ show a plot profile of signal intensity at the medial HC junction along the line shown in the merge panels (GPR156, yellow; ZO1, blue; FZD6 or VANGL2, magenta). c VANGL2 and FZD6 co-labeling in P0 Gpr156del cochleae. Co-enrichment at medial OHC junctions (arrowheads) is still observed in Gpr156 mutants, but less consistently. d FZD6 and ZO1 co-labeling in P0 Gpr156del cochleae. Reduced FZD6 enrichment in Gpr156 mutants (hollow arrowheads) compared to controls (solid arrowheads) corresponds to regions with aberrant support cell-support cell contacts. Arrows show support cells with an abnormal apical domain shape and location (schematized below each panel). Support cells: OPC, outer pillar cell, D1, Deiter 1 cell. e GPR156 labeling in E17.5 Vangl2Lp cochleae. In Vangl2Lp/Lp homozygotes, polarized GPR156 enrichment at the junction is lost in OHCs, but inverted in IHCs (arrowheads). Arrows show HC orientation based on the position of the basal body (PCNT) and the shape of the hair bundle (peanut agglutinin, PNA). f GPR156 enrichment at the medial (M) and lateral (L) junction in the same HC. GPR156 is expressed as the ratio of ZO1 signal (mean ± SD; n, HC numbers in 3 or more animals; Kruskal-Wallis test, ****p < 0.0001, ns is p > 0.9999 (IHC), p = 0.8111 (OHC)). Controls are pooled Vangl2+/+ and Vangl2Lp/+ samples. Scale bars are 5 µm (a, b, d), 10 µm (c, e).
|