FIGURE SUMMARY
Title

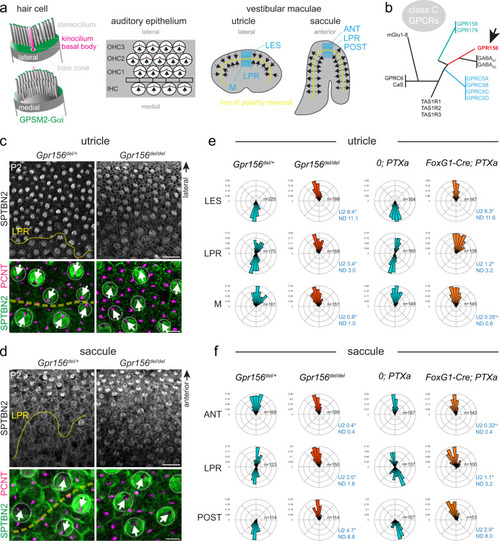
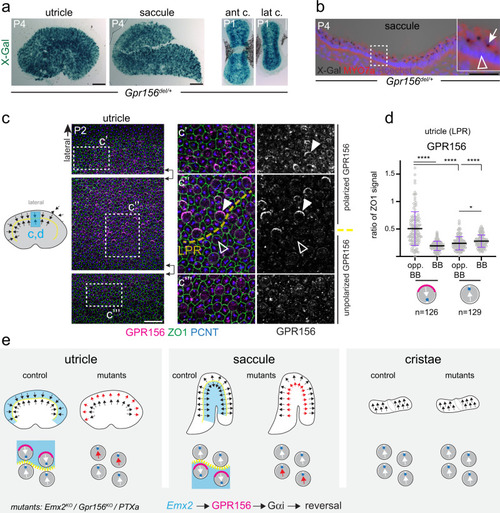
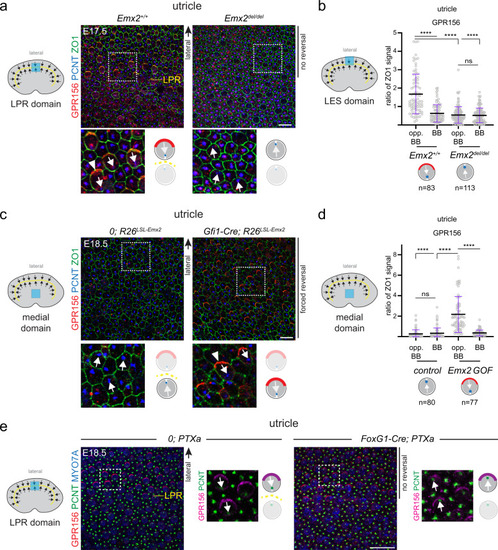
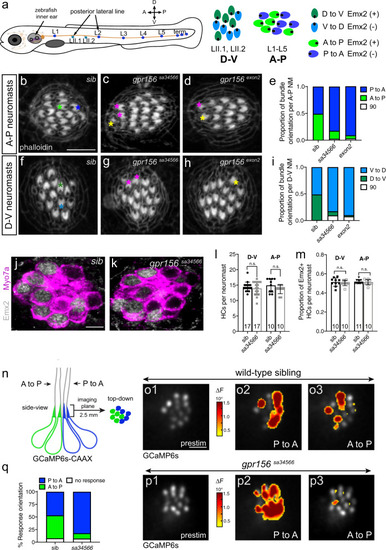
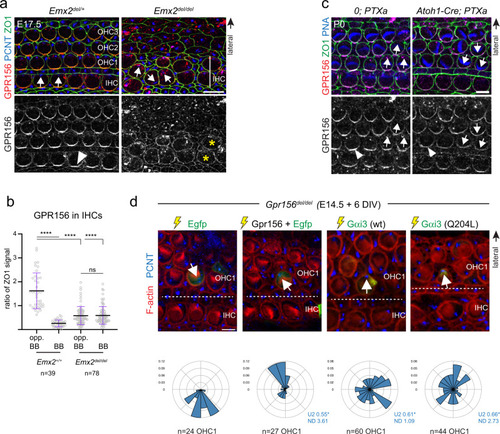
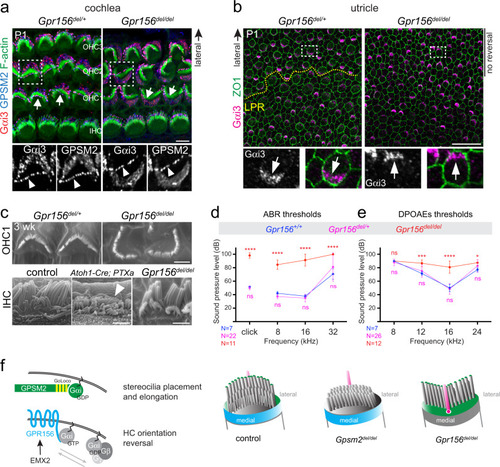
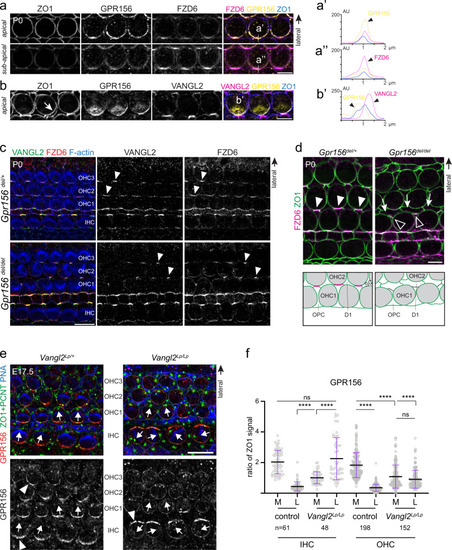
EMX2-GPR156-Gαi reverses hair cell orientation in mechanosensory epithelia

Authors
Kindt, K.S., Akturk, A., Jarysta, A., Day, M., Beirl, A., Flonard, M., Tarchini, B.
Source
Full text @ Nat. Commun.

<italic>Gpr156</italic> or Gαi inactivation abrogates hair cell reversal in the mouse maculae.

a Schemes representing a single auditory HC from the lateral/abneural (top) or medial/neural (bottom) side, and HC orientation (arrows) in the auditory epithelium and the utricular and saccular maculae. In the maculae, two HC populations of opposing orientations are separated by a virtual line of polarity reversal (LPR, yellow dashed line). Domains where HC orientation was quantified in e, f are indicated in blue (utricle: lateral extrastriolar (LES), LPR and medial (M) domains; saccule: anterior (ANT), LPR and posterior (POST) domains). b Phylogenetic tree of class C GPCRs adapted from62. c, d LPR region in P2 utricle (c) and saccule (d). Top panels show a low magnification view with SPTBN2 (βII-spectrin) labeling revealing HC orientation by the position of the off-center fonticulus devoid of signal. Bottom panels show a distinct region at higher magnification where PCNT (Pericentrin) labels the basal body below the fonticulus. The LPR can be traced in controls but not in mutants, where all HCs generally point laterally in the utricle and anteriorly in the saccule. e, f Circular histograms of HC orientation by region in the utricle (e) and saccule (f). Histograms show frequency distribution at P0-P2 (10° bins in a referential where 90° (top) is lateral in the utricle and anterior in the saccule; n indicates HC number in N = 4 animals; Watson U2 test of homogeneity; normalized difference (ND) value indicates how many standard deviations separate the circular means of each distribution). PTXa indicates the Cre-inducible R26-LSL-PTXa allele. Littermate controls for FoxG1-Cre; PTXa are Cre-negative PTXa animals. Arrows indicate HC orientation. Scale bars are 20 µm (c, d top), 5 µm (c, d bottom).

<italic>Gpr156</italic> expression and GPR156 protein localization in mouse vestibular organs.

aLacZ reporter is expressed throughout the sensory region in Gpr156del/+ vestibular organs (ant/lat c., anterior/lateral crista). bLacZ expression is limited to MYO7A+ HCs in a saccule cross-section. X-gal signal is trapped in HC vesicles (arrow in magnified inset) but support cells (arrowhead) are negative. c, d P2 wild-type utricle where basal body labeling (PCNT) indicates HC orientation. GPR156 polarization (solid arrowheads) is limited to lateral HCs oriented medially. HCs across the LPR oriented laterally do not show polarized GPR156 (hollow arrowheads). Boxed regions in continuous fields in the left panels are magnified in the central and right panels (saccule: see Supplementary Fig. 2c). d GPR156 enrichment in the utricle LPR domain at the HC junction opposite (opp. BB) or near (BB) the basal body. HCs oriented medially (left) are analyzed separately from HC oriented laterally (right). GPR156 is expressed as ratio of ZO1 signal (mean ± SD; n, HC numbers in 3 animals; Kruskal-Wallis test with Dunn’s multiple comparisons, ****p < 0.0001; *p = 0.0332). e Summary of HC orientation (arrows), GPR156 protein distribution (magenta) and previously reported Emx2 expression (blue) by vestibular organ in normal and mutant conditions. The scheme in c indicates the position of the domain analyzed in c and d (blue). Scale bars are 100 µm (a), 50 µm (b), 20 µm (c).

EMX2 > GPR156 > Gαi epistasis in the mouse macular organs.

a LPR domain in E17.5 utricles. Polarization of GPR156 in lateral HCs (arrowhead) is lost when EMX2 is missing and these HCs fail to reverse. b GPR156 enrichment in the lateral utricle (LES) domain. c Medial domain in E18.5 utricles. Ectopic expression of Emx2 reverses HC orientation and induces polarization of GPR156 (arrowhead) in medial HCs. d GPR156 enrichment in the utricle medial domain. e LPR domain in E18.5 utricles. Polarization of GPR156 in lateral HCs expressing PTXa is intact although these HCs fail to reverse. Utricles are labeled with GPR156, PCNT, and ZO1 (a, c) or MYO7A (e). In a, c, e boxed areas are magnified in the lower panels, and HC orientation and GPR156 distribution are summarized in a cartoon form. In b, d GPR156 enrichment is measured at the junction opposite (opp. BB) or near (BB) the basal body in the same HC. GPR156 is expressed as ratio of ZO1 signal (mean ± SD; n, HC numbers in 3 or more animals; Kruskal-Wallis test, ****p < 0.0001, ns p > 0.9999). Arrows indicate HC orientation based on PCNT-labeled basal body. Utricle schemes indicate the domain imaged or analyzed (blue). Yellow dashed lines represent the LPR in controls. See Supplementary Fig. 3 for related saccule and crista results. Scale bars are 10 µm (a, c), 20 µm (e).

Gpr156 dictates hair cell orientation reversal and directional sensitivity in zebrafish neuromasts.

a Schematic of the lateral-line system in a 5 day-post-fertilization zebrafish. Neuromast HCs show binary orientation along the antero-posterior (A–P) or dorso-ventral (D–V) axis as depicted. Emx2 is only expressed in HCs of one orientation in each neuromast (green D to V and A to P HCs). HC orientation is indicated by a black dot representing the off-center basal body. bi Phalloidin labeling in neuromasts reveals HC orientation by the lack of signal above the off-center basal body. In wild-type siblings (b, e, f, i), neuromasts contain an equal proportion of HCs with either orientation. In gpr156 mutants (ce, gi), there are more P to A (ce) and V to D (gi)-oriented HCs compared to wild-type siblings (Tukey’s multiple comparison test, P to A exon2 allele p < 0.0001, sa34566 allele p < 0.0001; V to D exon2 allele p < 0.0001, sa34566 allele p < 0.0001). Green and blue asterisks highlight the two HC orientations in wild-type sibling neuromasts. Magenta and yellow asterisks highlight outlier HCs oriented 180° or 90° compared to the majority of HCs in gpr156 mutants. n = 10 neuromasts and N ≥ 8 animals per genotype, examined at 5 dpf. j, k Emx2 and Myo7a co-labeling in neuromasts. Wild-type siblings and gpr156 mutants neuromasts have a similar number of HCs (l) (mean ± SEM; unpaired t-test (two-tailed), A-P p = 0.1686; Mann–Whitney test (two-tailed), D-V p = 0.8547), and a similar proportion of HCs express Emx2 per neuromast (m) (mean ± SEM; unpaired t-test (two-tailed), A-P p = 0.5756; Mann–Whitney test (two-tailed), D-V p = 0.4805). In lm the number of neuromasts (n) examined at 5 dpf in N ≥ 8 animals per genotype is indicated. n Scheme showing the GCaMP6s calcium reporter (blue and green) and the imaging plane in a neuromast. o1, p1 Baseline gray scale GCaMP6s images of the hair bundle imaging plane in wild-type siblings (o1) and gpr156 mutants (p1; sa34566 allele). o2, o3, p2, p3 Spatial patterns of GCaMP6s calcium signal increases in hair bundles during P to A (o2, p2) or A to P (o3, p3) directed fluid-jet stimulation. GCaMP6s signals are colorized according to the ∆F heat maps and superimposed onto prestimulus (prestim) baseline images (o1, p1). q In wild-type siblings, GCaMP6s signals are detected during both P to A and A to P directed stimulation (o2, o3). In contrast, compared to wild-type, in gpr156 mutants, significantly more hair bundles respond to P to A directed stimulation (p2p3) (Sidak’s multiple comparison test, P to A p = 0.0008; n = 8 neuromasts per genotype and N = 4 wild-type and N = 3 mutant animals, examined at 5 dpf. See Supplementary Fig. 4 for individual HC responses). NM, neuromast; sib, wild-type sibling. Scale bars are 5 µm (bd and fh, j, k, o13, and p1p3).

GPR156 expression and hair cell orientation defects upon Gαi or <italic>Gpr156</italic> inactivation in the mouse auditory epithelium.

aLacZ reporter is specifically expressed in HCs in the Gpr156del/+ auditory epithelium at P4 and P21 (right panels: cochlear base). b GPR156 immunolabeling shows polarized protein enrichment at the medial HC junction in control (left, arrowhead) but not Gpr156 mutant cochlear HCs (right). Peanut agglutinin (PNA) labels hair bundles in OHCs. c GPR156 enrichment per cochlear HC type at P0 (base) at the medial (M) and lateral (L) junction. GPR156 is expressed as ratio of ZO1 signal (mean ± SD; n, HC numbers in 3 animals; Mann-Whitney test (two-tailed), ****p < 0.0001). d P0 auditory epithelium at 3 positions along the cochlea (base, 15%; mid, 50%; apex, 75%). PCNT and phalloidin labeling respectively reveal HC orientation by the position of the off-center basal body and the hair bundle shape. Arrows indicate OHC1 orientation and the arrowhead indicates a rare misoriented IHC. Magnified insets: less mature OHCs at the apex are already reversed in orientation (see also Supplementary Fig. 5c-d). e, f Circular histograms of P4 HC orientation by row. Histograms show frequency distribution at 50% cochlea position (10° bins in a referential where 90° (top) is lateral and 0° (right) is towards the cochlear base; n indicates HC number in 5–7 animals; Watson U2 test of homogeneity; normalized difference (ND) value indicates how many standard deviations separate the circular means of each distribution). In e, PTXa indicates the Cre-inducible R26-LSL-PTXa allele. Littermate controls for Atoh1-Cre; PTXa are Cre-negative PTXa animals. Scale bars are 100 µm (a, left), 50 µm (a, right), 5 µm (b), 10 µm (d).

EMX2 > GPR156 > Gαi epistasis and HC-autonomous GPR156 > Gαi function in the mouse auditory organ.

a E17.5 cochleae labeled with GPR156, ZO1, and PCNT. Polarization of GPR156 in IHCs (arrowhead) is lost in Emx2 mutants (asterisks), and OHCs are missing (see Supplementary Fig. 6e). b GPR156 enrichment in IHCs. GPR156 enrichment is measured at the junction opposite (opp. BB) or near (BB) the basal body labeled with PCNT in the same HC. GPR156 is expressed as ratio of ZO1 signal (mean ± SD; n, HC numbers in 3 or more animals; Kruskal-Wallis test, ****p < 0.0001, ns p > 0.9999). c P0 cochleae labeled with GPR156, ZO1 and peanut agglutinin (PNA). GPR156 is polarized normally (arrowheads) when Gαi is inactivated by PTXa and OHCs show graded inversion by row. d Functional rescue of OHC1 orientation in Gpr156del/del cochlear explants. The constructs indicated were electroporated at E14.5, and the cochleae explanted and cultured for 6 days in vitro (DIV). The orientation of one electroporated OHC1 (green Egfp or Gαi3 signal) is indicated (arrows). Circular histograms show electroporated OHC1 orientation as a frequency distribution for the constructs indicated (20° bins in a referential where 90° (top) is lateral and 0° (right) is towards the cochlear base; n indicates OHC1 number in 10 or more explants representing 2 or more independent experiments; Watson U2 test of homogeneity; normalized difference (ND) value indicates how many standard deviations separate the circular means of each distribution). Note that Egfp and Gpr156 co-electroporation does not guarantee that Egfp+ OHC1 express Gpr156, probably explaining why some are not rescued. Arrows indicate HC orientation based on PCNT-labeled basal body (a, d) or PNA-labeled OHC hair bundle (c). In c best focus stack slice for PNA signal was combined with lower focus slice for GPR156-ZO1. Scale bars are 10 µm (a), 5 µm (c, d).

GPR156-Gαi and GPSM2-Gαi are distinct functional modules in developing hair cells.

a, b Normal apical enrichment of GPSM2-Gαi3 (a) or Gαi3 (b) in P1 Gpr156 mutant HCs in the cochlea (a) and utricle (b). Arrows indicate HC orientation. Note how GPSM2-Gαi3 enrichment follows HC orientation when HCs are inverted (OHC1-2s in a) or fail to reverse orientation (lateral HCs in b). Bottom panels show a magnified view of the HC boxed in the upper panels, and arrowheads point to GPSM2-Gαi3 at stereocilia tips (a). See Supplementary Fig. 7a for saccule results. c Scanning electron microscopy views of OHC1s (top) and IHCs (bottom) at 3 week (wk). IHC stereocilia stunting is obvious in PTXa (arrowhead) but not Gpr156 mutants. See Supplementary Fig. 7b for larger field views. d, e Auditory brainstem response (ABR, d) and distortion product otoacoustic emissions (DPOAEs, e) thresholds at ~4 week of age. X axis indicates broadband (click) and pure tone stimuli for ABR (d), or f2 for 2f1-f2 emission for DPOAEs (e). Y axis indicates the threshold of sound pressure level eliciting a response (d) or generating DPOAEs above noise floor (e) (mean ± SD; N indicates the number of animals tested per genotype; ABR click: Mann-Whitney test (two-tailed), ****p < 0.0001, ns p = 0.4943; ABR pure tones: two-way ANOVA with Sidak’s multiple comparisons, ****p < 0.0001, ns is p = 0.6928 (8 kHz), p = 0.9167 (16 kHz), p = 0.1061 (32 kHz); DPOAE: two-way ANOVA with Sidak’s multiple comparisons, Gpr156+/+ vs Gpr156del/del: ns p > 0.9999, ***p = 0.0001, ****p < 0.0001; *p = 0.0138; Gpr156+/+ vs Gpr156del/+: ns is p = 0.9103 (8 KHz), p = 0.6116 (12 kHz), p = 0.9512 (16 kHz), p = 0.299 (24 kHz)). f Working model. GPSM2-Gαi(GDP) (green) instructs stereocilia placement and elongation. In contrast, GPR156-Gαi(GTP) (blue) triggers HC orientation reversal downstream of EMX2. Scale bars are 5 µm (a), 20 µm (b), 2 µm (c).

Relationship between GPR156 and core PCP factors at the medial HC junction in the cochlea.

a, b P0 wild-type OHC2s. GPR156 co-labeling with ZO1 and either FZD6 (a) or VANGL2 (b). a GPR156 and FZD6 overlap at the medial junction, but the bulk of GPR156 is planar polarized at ZO1 level (top panels; apical), above the bulk of FZD6 (bottom panels; sub-apical, 0.4 µm more basally in the same confocal stack). b VANGL2 is mostly enriched on the support cell side of the medial HC junction, as apparent when TCA fixation separates the OHC and support cell plasma membranes (arrow). a′, a″, and b′ show a plot profile of signal intensity at the medial HC junction along the line shown in the merge panels (GPR156, yellow; ZO1, blue; FZD6 or VANGL2, magenta). c VANGL2 and FZD6 co-labeling in P0 Gpr156del cochleae. Co-enrichment at medial OHC junctions (arrowheads) is still observed in Gpr156 mutants, but less consistently. d FZD6 and ZO1 co-labeling in P0 Gpr156del cochleae. Reduced FZD6 enrichment in Gpr156 mutants (hollow arrowheads) compared to controls (solid arrowheads) corresponds to regions with aberrant support cell-support cell contacts. Arrows show support cells with an abnormal apical domain shape and location (schematized below each panel). Support cells: OPC, outer pillar cell, D1, Deiter 1 cell. e GPR156 labeling in E17.5 Vangl2Lp cochleae. In Vangl2Lp/Lp homozygotes, polarized GPR156 enrichment at the junction is lost in OHCs, but inverted in IHCs (arrowheads). Arrows show HC orientation based on the position of the basal body (PCNT) and the shape of the hair bundle (peanut agglutinin, PNA). f GPR156 enrichment at the medial (M) and lateral (L) junction in the same HC. GPR156 is expressed as the ratio of ZO1 signal (mean ± SD; n, HC numbers in 3 or more animals; Kruskal-Wallis test, ****p < 0.0001, ns is p > 0.9999 (IHC), p = 0.8111 (OHC)). Controls are pooled Vangl2+/+ and Vangl2Lp/+ samples. Scale bars are 5 µm (a, b, d), 10 µm (c, e).

Acknowledgments
This image is the copyrighted work of the attributed author or publisher, and ZFIN has permission only to display this image to its users. Additional permissions should be obtained from the applicable author or publisher of the image. Full text @ Nat. Commun.