|
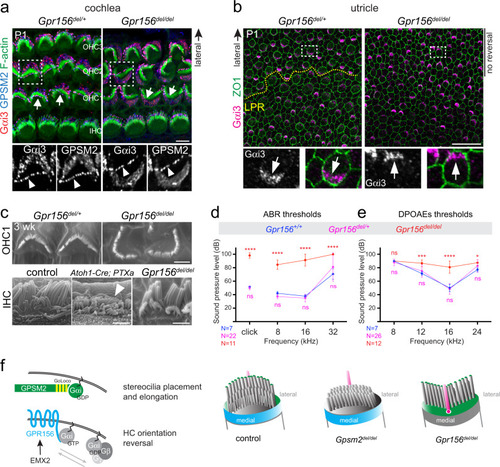
GPR156-Gαi and GPSM2-Gαi are distinct functional modules in developing hair cells.a, b Normal apical enrichment of GPSM2-Gαi3 (a) or Gαi3 (b) in P1 Gpr156 mutant HCs in the cochlea (a) and utricle (b). Arrows indicate HC orientation. Note how GPSM2-Gαi3 enrichment follows HC orientation when HCs are inverted (OHC1-2s in a) or fail to reverse orientation (lateral HCs in b). Bottom panels show a magnified view of the HC boxed in the upper panels, and arrowheads point to GPSM2-Gαi3 at stereocilia tips (a). See Supplementary Fig. 7a for saccule results. c Scanning electron microscopy views of OHC1s (top) and IHCs (bottom) at 3 week (wk). IHC stereocilia stunting is obvious in PTXa (arrowhead) but not Gpr156 mutants. See Supplementary Fig. 7b for larger field views. d, e Auditory brainstem response (ABR, d) and distortion product otoacoustic emissions (DPOAEs, e) thresholds at ~4 week of age. X axis indicates broadband (click) and pure tone stimuli for ABR (d), or f2 for 2f1-f2 emission for DPOAEs (e). Y axis indicates the threshold of sound pressure level eliciting a response (d) or generating DPOAEs above noise floor (e) (mean ± SD; N indicates the number of animals tested per genotype; ABR click: Mann-Whitney test (two-tailed), ****p < 0.0001, ns p = 0.4943; ABR pure tones: two-way ANOVA with Sidak’s multiple comparisons, ****p < 0.0001, ns is p = 0.6928 (8 kHz), p = 0.9167 (16 kHz), p = 0.1061 (32 kHz); DPOAE: two-way ANOVA with Sidak’s multiple comparisons, Gpr156+/+ vs Gpr156del/del: ns p > 0.9999, ***p = 0.0001, ****p < 0.0001; *p = 0.0138; Gpr156+/+ vs Gpr156del/+: ns is p = 0.9103 (8 KHz), p = 0.6116 (12 kHz), p = 0.9512 (16 kHz), p = 0.299 (24 kHz)). f Working model. GPSM2-Gαi(GDP) (green) instructs stereocilia placement and elongation. In contrast, GPR156-Gαi(GTP) (blue) triggers HC orientation reversal downstream of EMX2. Scale bars are 5 µm (a), 20 µm (b), 2 µm (c).
|