|
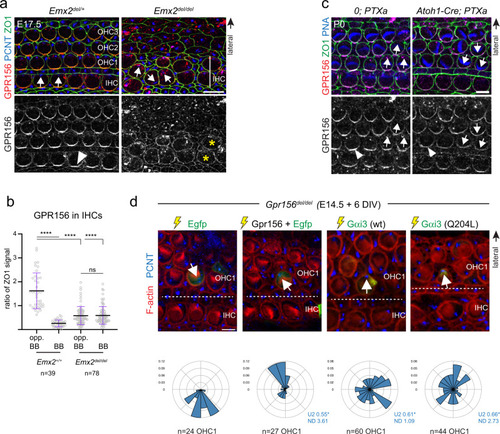
EMX2 > GPR156 > Gαi epistasis and HC-autonomous GPR156 > Gαi function in the mouse auditory organ.a E17.5 cochleae labeled with GPR156, ZO1, and PCNT. Polarization of GPR156 in IHCs (arrowhead) is lost in Emx2 mutants (asterisks), and OHCs are missing (see Supplementary Fig. 6e). b GPR156 enrichment in IHCs. GPR156 enrichment is measured at the junction opposite (opp. BB) or near (BB) the basal body labeled with PCNT in the same HC. GPR156 is expressed as ratio of ZO1 signal (mean ± SD; n, HC numbers in 3 or more animals; Kruskal-Wallis test, ****p < 0.0001, ns p > 0.9999). c P0 cochleae labeled with GPR156, ZO1 and peanut agglutinin (PNA). GPR156 is polarized normally (arrowheads) when Gαi is inactivated by PTXa and OHCs show graded inversion by row. d Functional rescue of OHC1 orientation in Gpr156del/del cochlear explants. The constructs indicated were electroporated at E14.5, and the cochleae explanted and cultured for 6 days in vitro (DIV). The orientation of one electroporated OHC1 (green Egfp or Gαi3 signal) is indicated (arrows). Circular histograms show electroporated OHC1 orientation as a frequency distribution for the constructs indicated (20° bins in a referential where 90° (top) is lateral and 0° (right) is towards the cochlear base; n indicates OHC1 number in 10 or more explants representing 2 or more independent experiments; Watson U2 test of homogeneity; normalized difference (ND) value indicates how many standard deviations separate the circular means of each distribution). Note that Egfp and Gpr156 co-electroporation does not guarantee that Egfp+ OHC1 express Gpr156, probably explaining why some are not rescued. Arrows indicate HC orientation based on PCNT-labeled basal body (a, d) or PNA-labeled OHC hair bundle (c). In c best focus stack slice for PNA signal was combined with lower focus slice for GPR156-ZO1. Scale bars are 10 µm (a), 5 µm (c, d).
|