
Fig. 4
- ID
- ZDB-FIG-210329-34
- Publication
- Heubel et al., 2020 - Endochondral growth zone pattern and activity in the zebrafish pharyngeal skeleton
- Other Figures
- All Figure Page
- Back to All Figure Page
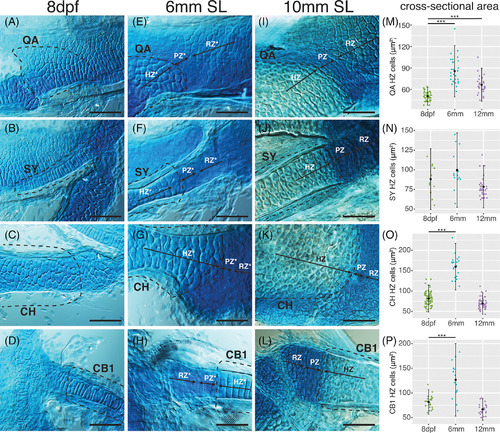
Endochondral growth zone development in zebrafish. A‐D, Alcian blue stained cartilages of 8 dpf zebrafish with presumptive A, QA; B, SY; C, CH; and D, CB1 labeled (dashed line). E‐H, Alcian blue stained cartilages of 6 mm (SL) zebrafish with labeled presumptive resting (RZ), proliferative (PZ) and hypertrophic (HZ) zones associated with the, E, QA; F, SY; G, CH; and H, CB1 (dashed lines). I‐L, Alcian blue stained cartilages of 10 mm (SL) zebrafish with labeled presumptive RZ, PZ and HZ associated with the, I, QA; J, SY; K, CH; and L, CB1 (dashed lines). M‐P, Cell cross‐sectional area (μm2) in 8 dpf, 6 mm (SL) and 10 mm (SL) presumptive HZ cells of the, M, QA; N, SY; O, CH; and P, CB1. Scale bar: 50 μm. CB1, ceratobranchial 1; CH, ceratohyal; HZ, hypertrophic zone; PZ, proliferative zone; QA, quadrate; RZ, resting zone; SY, symplectic, *, presumptive |