
- Title
-
Endochondral growth zone pattern and activity in the zebrafish pharyngeal skeleton
- Authors
- Heubel, B.P., Bredesen, C.A., Schilling, T.F., Le Pabic, P.
- Source
- Full text @ Dev. Dyn.
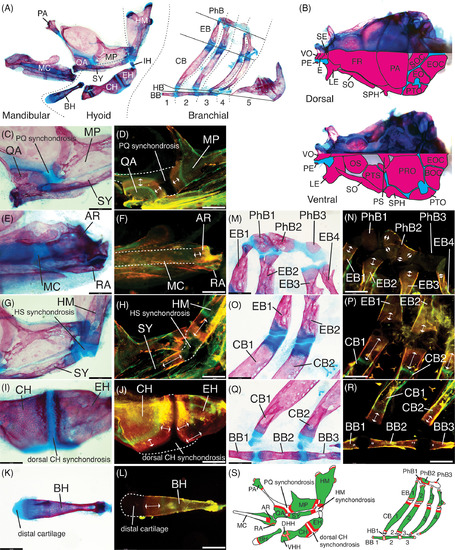
Endochondral growth zone locations in the zebrafish pharyngeal skeleton (13.5 mm SL). Bone stained with alizarin red, cartilage stained with alcian blue in panels A, B, C, E, G, I, K, M, O, Q. Old bone stained with calcein green, new bone stained with alizarin red in panels D, F, H, J, L, N, P, R. A, Anatomy of pharyngeal skeleton, including mandibular, hyoid, and branchial regions. B, Anatomy of neurocranial skeleton in dorsal and ventral views, with camera lucida outlines of bones in lower half of each image to facilitate identification. Synchondroses separating bones are colored in blue. C‐F, Mandibular skeleton regions. C, QA and MP bones across PQ synchondrosis. D, QA and MP growth. E, AR and RA bones and MC. F, AR growth. G‐L, Hyoid skeleton regions. G, HM and SY bones across HS synchondrosis. H, HM and SY growth. I, CH and EH bones across dorsal CH synchondrosis. J, CH and EH growth. K, BH bone and distal cartilage. L, BH growth. M‐R, Branchial skeleton regions. M, PhB1‐3 bones with cartilage pads and EB1‐4 bones with dorsal distal cartilages. N, PhB 1and 3 ossification, PhB2 growth and EB dorsal growth. O, EB1‐2 and CB1‐2 bones with distal cartilages. P, EB ventral growth and CB dorsal growth. Q, CB1‐2 bones with ventral distal cartilages and BB1‐3 bones across BB synchondroses. R, CB ventral growth and BB growth. S, Summary of locations of new bone (red) deposition detected in the pharyngeal arch cartilage‐derived skeleton. Scale bar: 140 μm. Dorsal mandibular arch: MP, metapterygoid, PA, palatine, PQ, palatoquadrate, QA, quadrate. Ventral mandibular arch: AR, articular; MC, Meckel's cartilage; RA, retroarticular. Dorsal hyoid arch: HM, hyomandibula; HS, hyosymplectic; IH, interhyal; SY, symplectic. Ventral hyoid arch: BH, basihyal; CH, ceratohyal; DHH, dorsal hypohyal; EH, epihyal; VHH, ventral hypohyal. Branchial arches: BB, basibranchial; CB, ceratobranchial; EB, epibranchial; HB, hypobranchial; PhB, pharyngobranchial. Neurocranium: BOC, basioccipital, E, ethmoid; EO, epioccipital; EOC, exoccipital; FR, frontal; LE, lateral ethmoid; OS, orbitosphenoid; PE, preethmoid; PRO, prootic; PS, parasphenoid; PTO, pterotic; PTS, pterosphenoid; SE, supraethmoid; SO, supraorbital; SOC, supraoccipital; SPH, sphenotic; VO, vomer |
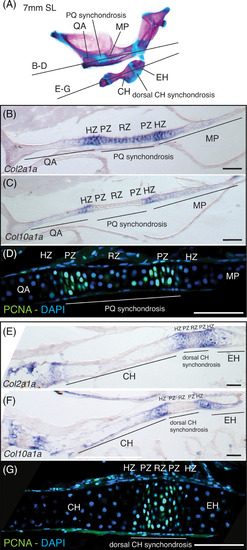
Molecular analysis of bidirectional endochondral growth zones in zebrafish. A, Section planes shown on alizarin red and alcian blue stained skeleton of 7 mm (SL) zebrafish mandibular and hyoid arches. B, Col2a1a expression in PQ synchondrosis and flanking QA and MP bones. C, Col10a1a expression in putative hypertrophic zones on either side of the PQ synchondrosis. D, anti‐PCNA immunostaining of presumptive proliferative and resting zone cells in PQ synchondrosis. E, Col2a1a expression in dorsal CH synchondrosis and flanking CH and EH bones. F, Col10a1a expression in putative hypertrophic zones on either sides of the dorsal CH synchondrosis. G, anti‐PCNA immunostaining of presumptive proliferative and resting zone cells in CH synchondrosis. Scale bar: 75 μm. CH, ceratohyal; EH, epihyal; HZ, hypertrophic zone; MP, metapterygoid; PZ, proliferative zone; PQ, palatoquadrate; QA, quadrate; RZ, resting zone |
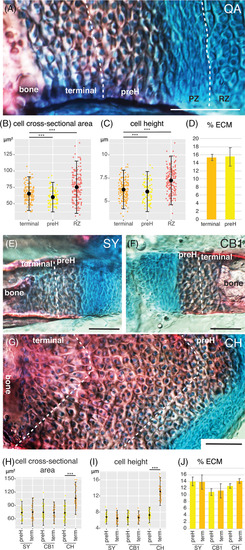
Cellular enlargement and cartilage matrix synthesis in zebrafish hypertrophic zones. A, Resting, proliferative, prehypertrophic and terminal hypertrophic zones and bone front in the QA bone and flanking PQ synchondrosis stained with alizarin red and alcian blue. B,C, Cell cross‐sectional area (μm2) and height (μm), respectively, in RZ, preH and terminal HZ cells of the QA bone. C, Cell height (μm) in RZ, preH and terminal HZ cells of the QA bone. D, Percentage of surface occupied by ECM in preH and terminal HZs of the QA bone. E,F,G, PreH and terminal hypertrophic zones in the SY, CB1 and CH bone and flanking HS synchondroses, respectively, stained with alizarin red and alcian blue. H,I, Cell cross‐sectional area (μm2) and height (μm), respectively, in preH and terminal HZ cells of the SY, CB1 and CH bones. J, Percentage of surface occupied by ECM in preH and terminal HZs of the SY, CB1 and CH bones. Scale bar: 50 μm. CB1, ceratobranchial 1; CH, ceratohyal; ECM, extracellular matrix; HS, hyosymplectic; PQ, palatoquadrate; preH, prehypertrophic; PZ, proliferating zone; QA, quadrate; RZ, resting zone; SY, symplectic |
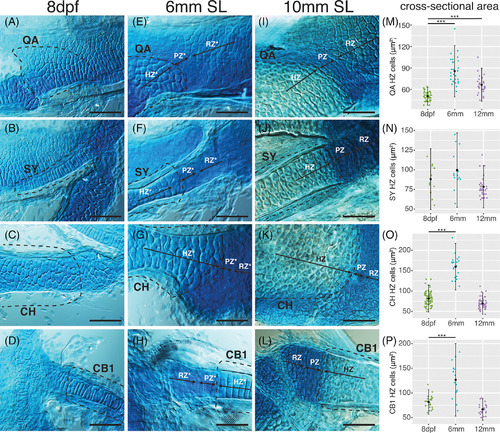
Endochondral growth zone development in zebrafish. A‐D, Alcian blue stained cartilages of 8 dpf zebrafish with presumptive A, QA; B, SY; C, CH; and D, CB1 labeled (dashed line). E‐H, Alcian blue stained cartilages of 6 mm (SL) zebrafish with labeled presumptive resting (RZ), proliferative (PZ) and hypertrophic (HZ) zones associated with the, E, QA; F, SY; G, CH; and H, CB1 (dashed lines). I‐L, Alcian blue stained cartilages of 10 mm (SL) zebrafish with labeled presumptive RZ, PZ and HZ associated with the, I, QA; J, SY; K, CH; and L, CB1 (dashed lines). M‐P, Cell cross‐sectional area (μm2) in 8 dpf, 6 mm (SL) and 10 mm (SL) presumptive HZ cells of the, M, QA; N, SY; O, CH; and P, CB1. Scale bar: 50 μm. CB1, ceratobranchial 1; CH, ceratohyal; HZ, hypertrophic zone; PZ, proliferative zone; QA, quadrate; RZ, resting zone; SY, symplectic, *, presumptive |
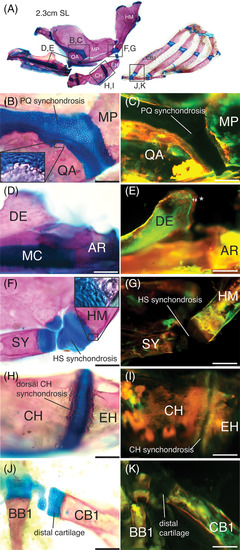
Endochondral growth arrest in adult zebrafish. A, Anatomy of one‐year old adult zebrafish cartilage‐derived pharyngeal skeleton with alizarin red stained bone and alcian blue stained cartilage. Frames indicate regions highlighted in panels B to K. B, Alcian blue stained PQ synchondrosis flanked by alizarin red stained QA and MP bones. Chondrocytes are absent from the QA and MP, as shown in higher magnification inset. C, Bone matrix of the QA and MP flanking the PQ synchondrosis is stained by both alizarin red and calcein green. D, Alcian blue stained MC flanked posteriorly by alizarin red stained AR bone. E, Bone matrix of the AR flanking MC is stained by both alizarin red and calcein green. New bone growth on DE is stained by alizarin red alone (double‐arrow and *). F, Alcian blue stained HS synchondrosis flanked by alizarin red stained SY and HM bones. Chondrocytes are absent from the SY and HM, as shown in higher magnification inset. G, Bone matrix of the SY and HM flanking the HS synchondrosis is stained with both alizarin red and calcein green. H, Alcian blue stained dorsal CH synchondrosis flanked by alizarin red stained CH and EH bones. Chondrocytes are absent from the CH and EH. I, Bone matrix of the CH and EH flanking the dorsal CH synchondrosis is stained by both alizarin red and calcein green. J, Alcian blue stained CB1 distal cartilage flanked by alizarin red stained CB1 bone. Chondrocytes are absent from the CB1. K, Bone matrix of the CB1 flanking the distal cartilage is stained by both alizarin red and calcein green. Scale bar: 640 μm. AR, articular; BB1, basibranchial 1; CB1, ceratobranchial 1; CH, ceratohyal; DE, dentary; EH, epihyal; HM, hyomandibula; HS, hyosymplectic; MC, Meckel's cartilage; MP, metapterygoid; PQ, palatoquadrate; QA, quadrate; SY, symplectic |