
Fig. 3
- ID
- ZDB-FIG-210329-33
- Publication
- Heubel et al., 2020 - Endochondral growth zone pattern and activity in the zebrafish pharyngeal skeleton
- Other Figures
- All Figure Page
- Back to All Figure Page
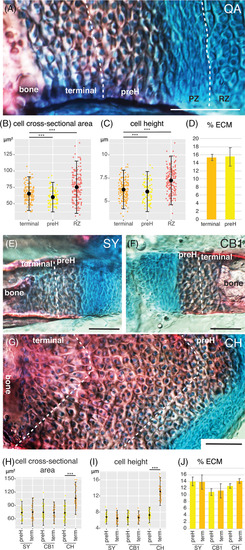
Cellular enlargement and cartilage matrix synthesis in zebrafish hypertrophic zones. A, Resting, proliferative, prehypertrophic and terminal hypertrophic zones and bone front in the QA bone and flanking PQ synchondrosis stained with alizarin red and alcian blue. B,C, Cell cross‐sectional area (μm2) and height (μm), respectively, in RZ, preH and terminal HZ cells of the QA bone. C, Cell height (μm) in RZ, preH and terminal HZ cells of the QA bone. D, Percentage of surface occupied by ECM in preH and terminal HZs of the QA bone. E,F,G, PreH and terminal hypertrophic zones in the SY, CB1 and CH bone and flanking HS synchondroses, respectively, stained with alizarin red and alcian blue. H,I, Cell cross‐sectional area (μm2) and height (μm), respectively, in preH and terminal HZ cells of the SY, CB1 and CH bones. J, Percentage of surface occupied by ECM in preH and terminal HZs of the SY, CB1 and CH bones. Scale bar: 50 μm. CB1, ceratobranchial 1; CH, ceratohyal; ECM, extracellular matrix; HS, hyosymplectic; PQ, palatoquadrate; preH, prehypertrophic; PZ, proliferating zone; QA, quadrate; RZ, resting zone; SY, symplectic |