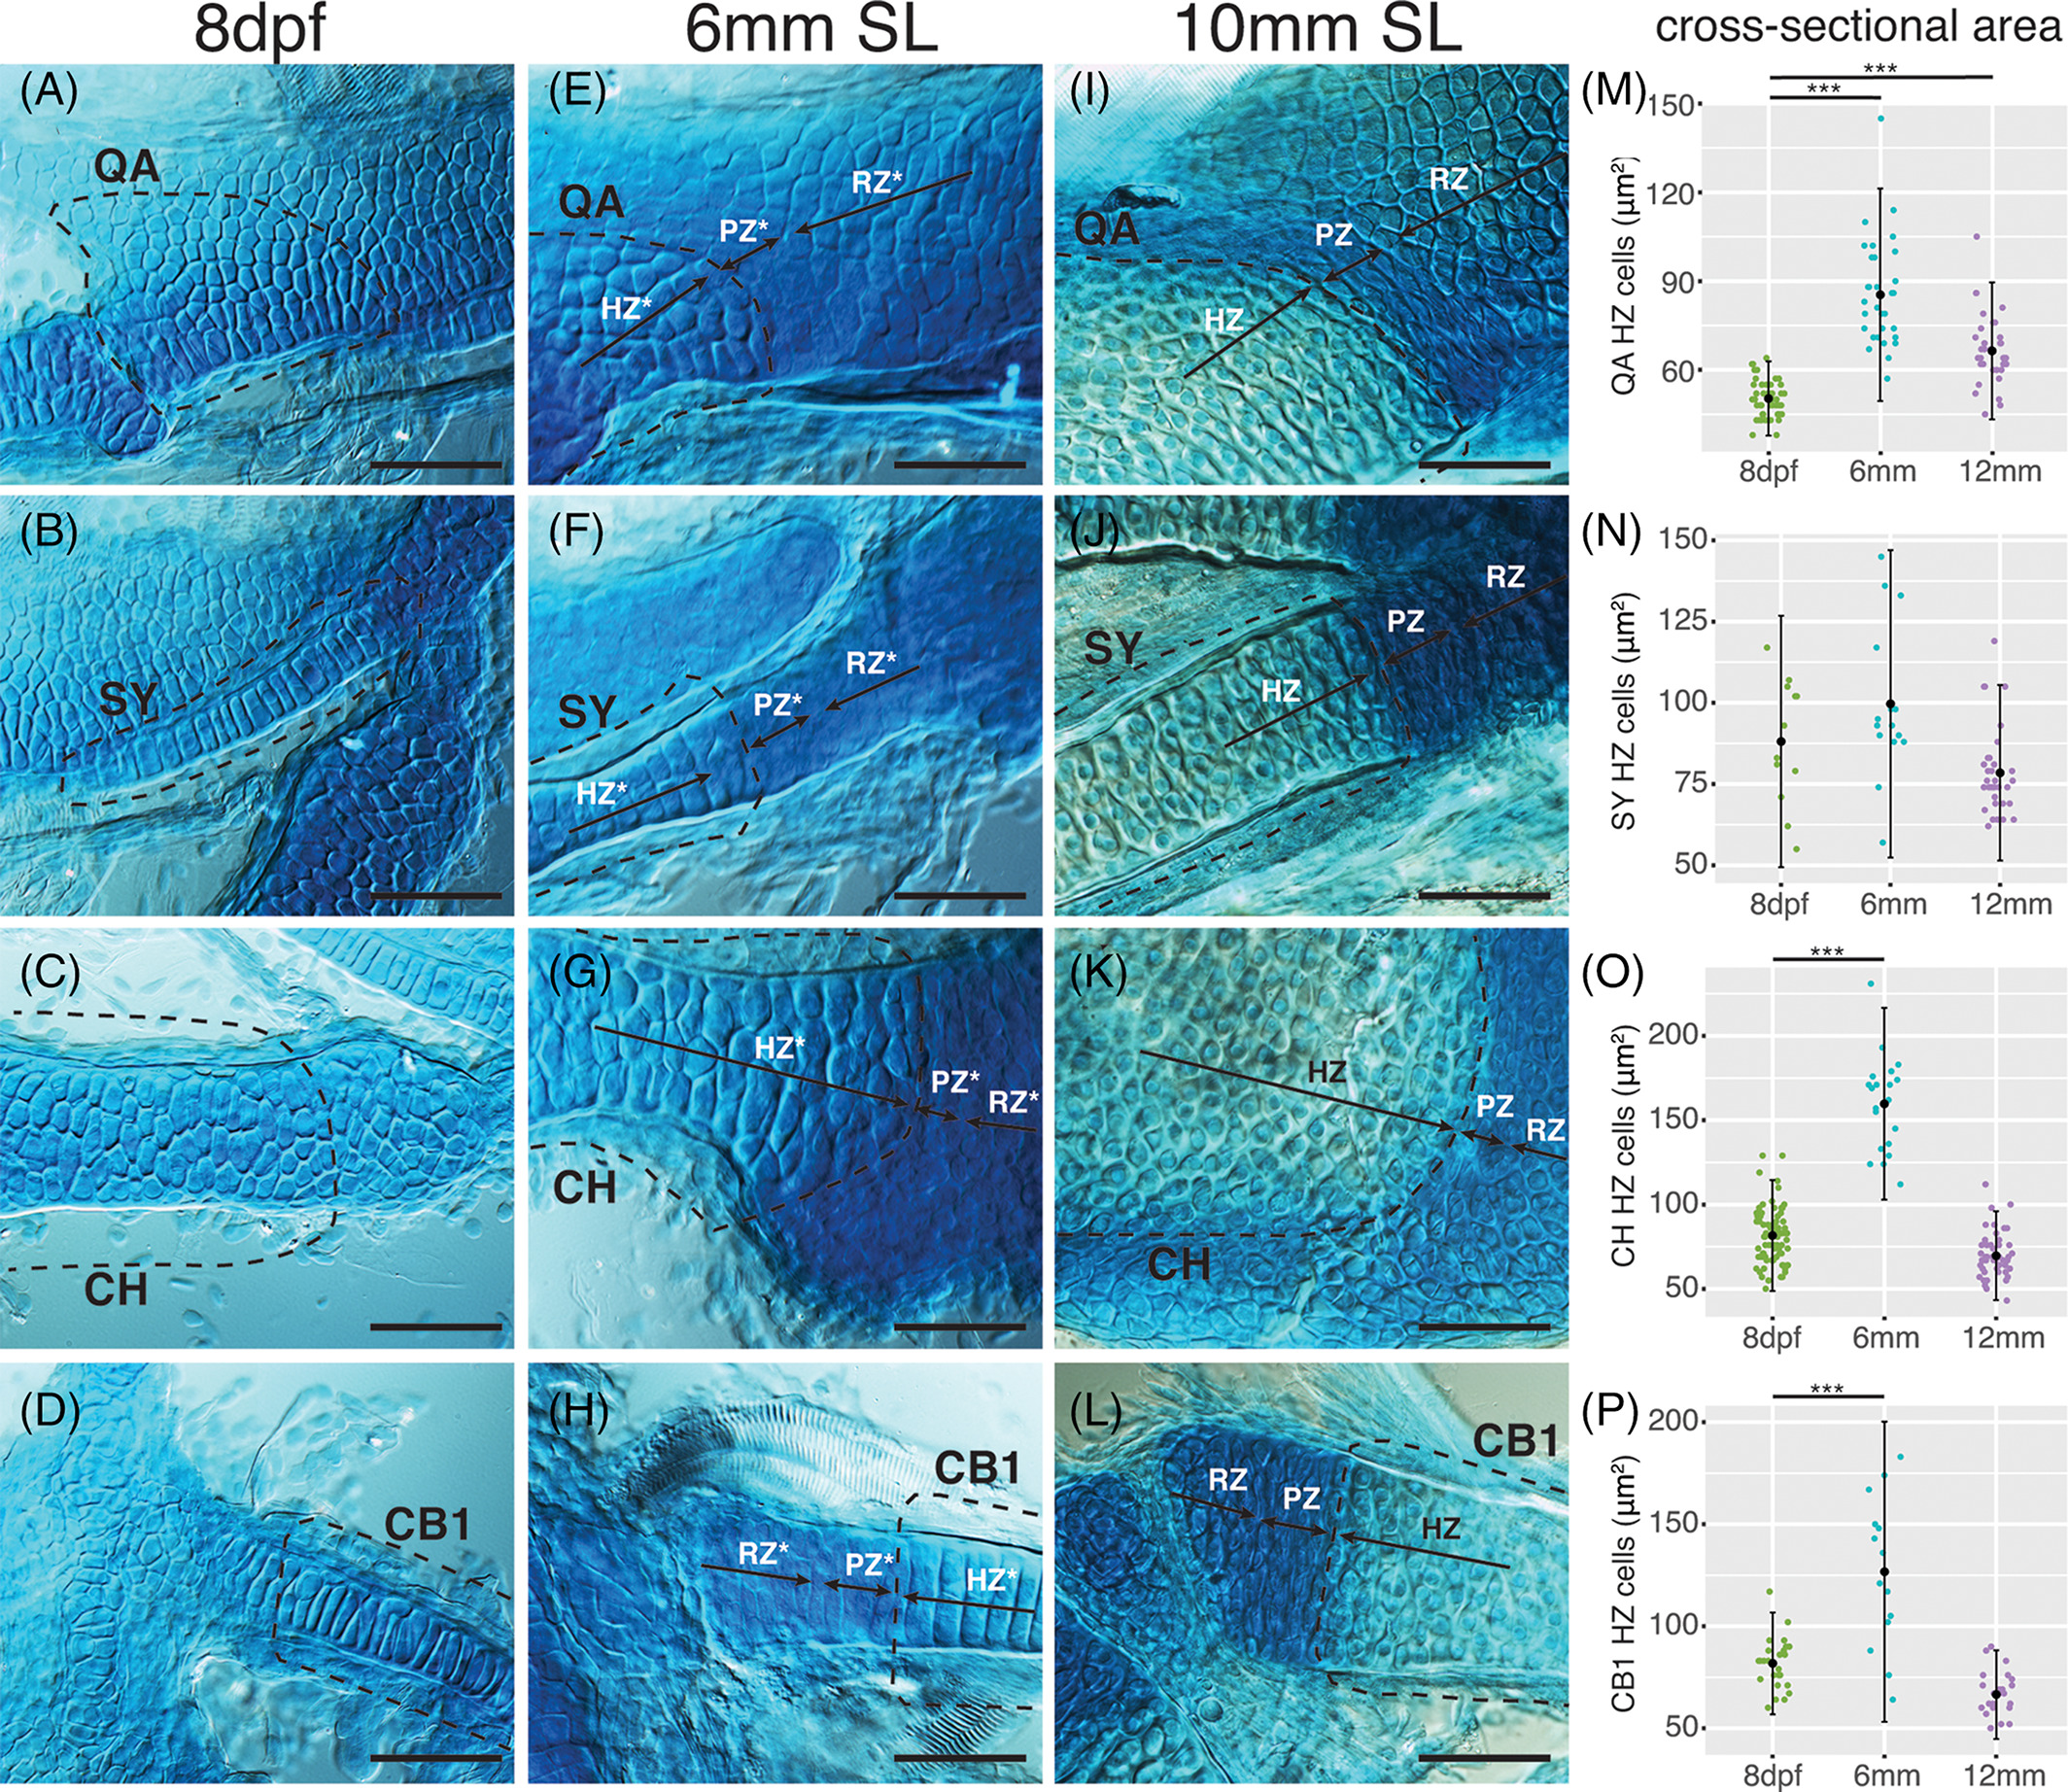
Fig. 4 Endochondral growth zone development in zebrafish. A‐D, Alcian blue stained cartilages of 8 dpf zebrafish with presumptive A, QA; B, SY; C, CH; and D, CB1 labeled (dashed line). E‐H, Alcian blue stained cartilages of 6 mm (SL) zebrafish with labeled presumptive resting (RZ), proliferative (PZ) and hypertrophic (HZ) zones associated with the, E, QA; F, SY; G, CH; and H, CB1 (dashed lines). I‐L, Alcian blue stained cartilages of 10 mm (SL) zebrafish with labeled presumptive RZ, PZ and HZ associated with the, I, QA; J, SY; K, CH; and L, CB1 (dashed lines). M‐P, Cell cross‐sectional area (μm2) in 8 dpf, 6 mm (SL) and 10 mm (SL) presumptive HZ cells of the, M, QA; N, SY; O, CH; and P, CB1. Scale bar: 50 μm. CB1, ceratobranchial 1; CH, ceratohyal; HZ, hypertrophic zone; PZ, proliferative zone; QA, quadrate; RZ, resting zone; SY, symplectic, *, presumptive
Image
Figure Caption
Acknowledgments
This image is the copyrighted work of the attributed author or publisher, and
ZFIN has permission only to display this image to its users.
Additional permissions should be obtained from the applicable author or publisher of the image.
Full text @ Dev. Dyn.

